Scaling Network Services and VNF Instances
Reference diagram
The following diagram summarizes the feature:
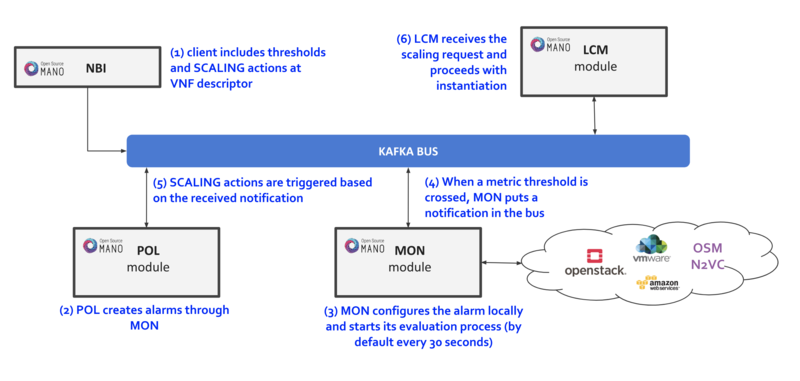
Scaling descriptors can be included and be tied to automatic reaction to VIM/VNF metric thresholds.
Supported metrics are both VIM and VNF metrics. More information about metrics collection can be found at the Performance Management documentation
An internal alarm manager has been added to MON through the ‘mon-evaluator’ module, so that both VIM and VNF metrics can also trigger threshold-violation alarms and scaling actions. More information about this module can be found at the Fault Management documentation
Scaling Descriptor
The scaling descriptor is part of a VNFD. Like the example below shows, it mainly specifies:
An existing metric to be monitored, which should be pre-defined in the monitoring-param list (
vnf-monitoring-param-ref).The VDU to be scaled (
aspect-delta-details:deltas:vdu-delta:id) and the amount of instances to scale per event (number-of-instances)The thresholds to monitor (
scale-in/out-threshold)The VDU’s (
vdu-profile:id) minimum and maximum amount of scaled instances to produceThe minimum time it should pass between scaling operations (
cooldown-time)The minimum amount of scaled instances to produce (
max-scale-level)
    scaling-aspect:
    - aspect-delta-details:
        deltas:
        - id: vdu_autoscale-delta
          vdu-delta:
          - id: hackfest_basic_metrics-VM
            number-of-instances: 1
      id: vdu_autoscale
      max-scale-level: 1
      name: vdu_autoscale
      scaling-policy:
      - cooldown-time: 5
        name: cpu_util_above_threshold
        scaling-criteria:
        - name: cpu_util_above_threshold
          scale-in-relational-operation: LT
          scale-in-threshold: 10
          scale-out-relational-operation: GT
          scale-out-threshold: 60
          vnf-monitoring-param-ref: vnf_cpu_util
        scaling-type: automatic
        threshold-time: 1
    vdu-profile:
    - id: hackfest_basic_metrics-VM
      max-number-of-instances: 2
      min-number-of-instances: 1
How to enable/disable autoscaling
With the previous SA architecture based on POL and MON, it is possible to enable/disable autoscaling by patching the POL deployment in kubernetes:
The steps are given below:
To enable the autoscaling feature, modify the env
OSMPOL_AUTOSCALE_ENABLEDtoTrueinpoldeployment:kubectl -n osm edit deployment pol
OSMPOL_AUTOSCALE_ENABLED: True
To disable the autoscaling feature, modify the env
OSMPOL_AUTOSCALE_ENABLEDtoFalseinpoldeployment:kubectl -n osm edit deployment pol
OSMPOL_AUTOSCALE_ENABLED: False
With the new architecture, Airflow DAGs for scaling can be selectively disabled in Airflow UI by pressing the toggle next to the DAG to pause/unpause it:
scalein_vdu, to enable/disable auto-scale-inscaleout_vdu, to enable/disable auto-scale-out
Example
This will launch a Network Service formed by an HAProxy load balancer and an (autoscalable) Apache web server. Please check:
Your VIM has an accesible ‘public’ network and a management network (in this case called “PUBLIC” and “vnf-mgmt”)
Your VIM has the ‘haproxy_ubuntu’ and ‘apache_ubuntu’ images, which can be found here
Get the descriptors:
git clone --recursive https://osm.etsi.org/gitlab/vnf-onboarding/osm-packages.git
Onboard them:
cd osm-packages
osm vnfd-create wiki_webserver_autoscale_vnfd
osm nsd-create wiki_webserver_autoscale_nsd
Launch the NS:
osm ns-create --ns_name web01 --nsd_name wiki_webserver_autoscale_ns --vim_account <VIM_ACCOUNT_NAME>|<VIM_ACCOUNT_ID>
osm ns-list
osm ns-show web01
Testing:
To ensure the NS is working, visit the Load balancer’s IP at the public network using a browser, the page should show an OSM logo and active VDUs.
To check metrics at Prometheus, visit
http://[OSM_IP]:9091and look forosm_cpu_utilizationandosm_average_memory_utilization(initial values could take some some minutes depending on your telemetry system’s granularity).To check metrics at Grafana, just visit
http://[OSM_IP]:3000(admin/admin), you will find a sample dashboard (the two top charts correspond to this example).To increase CPU in this example to auto-scale the web server, install Apache Bench in a client within reach (could be the OSM host) and run it towards
test.php.
sudo apt install apache2-utils
ab -n 5000000 -c 2 http://<load-balancer-ip>/test.php
# Can also be run in the HAproxy machine.
ab -n 10000000 -c 1000 http://<Private IP of Apache webserver>:8080/
# This will stress CPU to 100% and trigger a scale-out operation in POL.
# In this test, scaling will usually go up to 3 web servers before HAProxy spreads to load to reach a normal CPU level (w/ 60s granularity, 180s cooldown)
If HA proxy is not started
service haproxy status
sudo service haproxy restart
Any of the VMs can be accessed through SSH (credential: ubuntu/osm2021) to further monitor (with htop, for example), and there is an HAProxy UI at port http://[HAProxy_IP]:32700 (credential: osm/osm2018)