Monitoring Network Services and VNF Instances
Performance Management
VNF performance management
OSM automatically monitors the status of every VM running in the VIM account. In addition, OSM can collect VM resource consumption metrics such as CPU usage, memory usage, disk usage, and I/O packet rates. For resource consumption metrics to be collected, your VIM must support a Telemetry system. Currently, the collection of VM resource consumption metrics in OSM works with:
OpenStack telemetry services: VIM-legacy (ceilometer-based), Gnocchi-based or Prometheus.
Microsoft Azure.
Google Cloud Platform.
VMware vCloud Director with vRealizeOperations.
Next step is to activate metrics collection at your VNFDs. Every metric to be collected from the VIM for each VDU has to be described both at the VDU level, and then at the VNF level. For example:
vdu:
   id: hackfest_basic_metrics-VM
  ...
    monitoring-parameter:
    - id: vnf_cpu_util
      name: vnf_cpu_util
      performance-metric: cpu_utilization
    - id: vnf_memory_util
      name: vnf_memory_util
      performance-metric: average_memory_utilization
    - id: vnf_packets_sent
      name: vnf_packets_sent
      performance-metric: packets_sent
    - id: vnf_packets_received
      name: vnf_packets_received
      performance-metric: packets_received
As you can see, a list of “NFVI metrics” is defined first at the VDU level, which contains an ID and the corresponding normalized metric name (in this case, cpu_utilization and average_memory_utilization). Normalized metric names are: cpu_utilization, average_memory_utilization, disk_read_ops, disk_write_ops, disk_read_bytes, disk_write_bytes, packets_received, packets_sent, packets_out_dropped, packets_in_dropped
Not all metrics can be collected from all types of VIMs, the following table shows which metrics are supported by each type of VIM:
| Metric | Openstack | Azure | GCP |
|---|---|---|---|
| cpu_utilization | X | X | X |
| average_memory_utilization | X | X | |
| disk_read_ops | X | X | X |
| disk_write_ops | X | X | X |
| disk_read_bytes | X | X | X |
| disk_write_bytes | X | X | X |
| packets_in_dropped | X | ||
| packets_out_dropped | X | ||
| packets_received | X | X | |
| packets_sent | X | X |
Available attributes and values can be directly explored at the OSM Information Model. A complete VNFD example can be downloaded from here.
VMware vCD specific notes (OLD)
Since REL6 onwards, MON collects all the normalized metrics, with the following exceptions:
packets_in_droppedis not available and will always return 0.packets_receivedcannot be measured. Instead the number of bytes received for all interfaces is returned.packets_sentcannot be measured. Instead the number of bytes sent for all interfaces is returned.
The rolling average for vROPS metrics is always 5 minutes. The collection interval is also 5 minutes, and can be changed, however, it will still report the rolling average for the past 5 minutes, just updated according to the collection interval. See https://kb.vmware.com/s/article/67792 for more information.
Although it is not recommended, if a more frequent interval is desired, the following procedure can be used to change the collection interval:
Log into vROPS as an admin.
Navigate to Administration and expand Configuration.
Select Inventory Explorer.
Expand the Adapter Instances and select vCenter Server.
Edit the vCenter Server instance and expand the Advanced Settings.
Edit the Collection Interval (Minutes) value and set to the desired value.
Click OK to save the change.
Infrastructure Status Collection
OSM MON collects, automatically, “status metrics” for:
VIMs - each VIM that OSM establishes contact with, the metric will be reflected with the name
osm_vim_statusin the TSDB.VMs - VMs for each VDU that OSM has instantiated, the metric will be reflected with the name
osm_vm_statusin the TSDB.
Metrics will be “1” or “0” depending on the element availability.
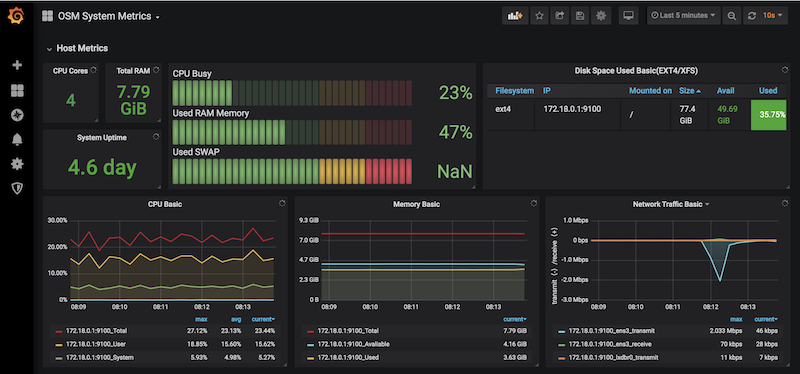
System Metrics
OSM collects system-wide metrics directly using Prometheus exporters. The way these metrics are collected is highly dependant on how OSM was installed:
| OSM on Kubernetes | OSM on Docker Swarm | |
|---|---|---|
| Components | Prometheus Operator Chart / Other charts: MongoDB, MySQL and Kafka exporters | Node exporter / CAdvisor exporter |
| Implements | Multiple Grafana dashboards for a comprehensive health check of the system. | Single Grafana dashboard with the most important system metrics. |
The name with which these metrics are stored in Prometheus also depends on the installation, so Grafana Dashboards will be available by default, already showing these metrics. Please note that the K8 installation requires the optional Monitoring stack.
Retrieving OSM metrics from Prometheus TSDB
Once the metrics are being collected, they are stored in the Prometheus Time-Series DB with an ‘osm_’ prefix, and there are a number of ways in which you can retrieve them.
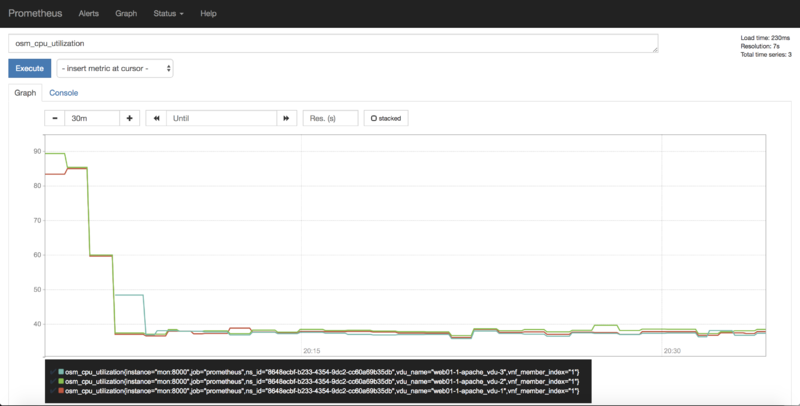
1) Visualizing metrics in Prometheus UI
Prometheus TSDB includes its own UI, which you can visit at http://[OSM_IP]:9091.
From there, you can:
Type any metric name (i.e.
osm_cpu_utilization) in the ‘expression’ field and see its current value or a histogram.Visit the Status –> Target menu, to monitor the connection status between Prometheus and MON (through
mon-exporter)
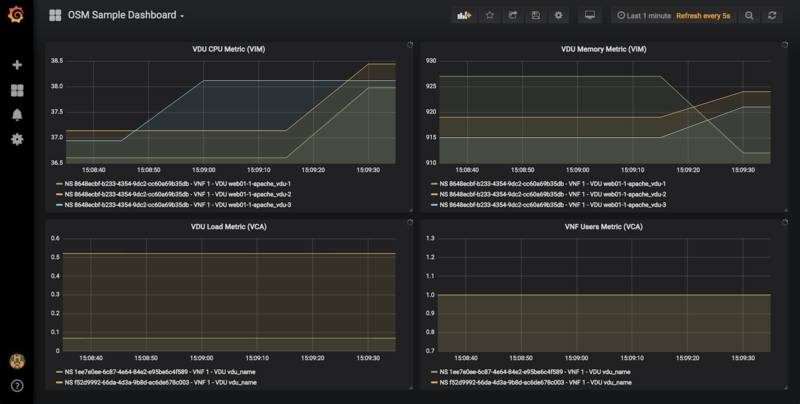
2) Visualizing metrics in Grafana
Starting in Release 7, OSM includes by default its own Grafana installation (deprecating the former experimental pm_stack)
Access Grafana with its default credentials (admin / admin) at http://[OSM_IP_address]:3000 and by clicking the ‘Manage’ option at the ‘Dashboards’ menu (to the left), you will find a sample dashboard containing two graphs for VIM metrics, and two graphs for VNF metrics. You can easily change them or add more, as desired.
Dashboard Automation
Starting in Release 7, Grafana Dashboards are created by default in OSM. This is done by the “dahboarder” service in MON, which provisions Grafana following changes in the common DB.
| Updates in | Automates these dashboards |
|---|---|
| OSM installation | System Metrics, Admin Project-scoped |
| OSM Projects | Project-scoped |
| OSM Network Services | NS-scoped sample dashboard |
3) Querying metrics through OSM SOL005-based NBI
For collecting metrics through the NBI, the following URL format should be followed:
https://<host-ip>:<nbi-port>/osm/nspm/v1/pm_jobs/<project-id>/reports/<network-service-id>
Where:
<host-ip>: Is the machine where OSM is installed.<nbi-port>: The NBI port, i.e. 9999<project-id>: Currently it can be any string.<network-service-id>: It is the NS ID got after instantiation of network service.
Please note that a token should be obtained first in order to query a metric. More information on this can be found in the OSM NBI Documentation
In response, you would get a list of the available VNF metrics, for example:
   performanceMetric: osm_cpu_utilization
   performanceValue:
       performanceValue:
           performanceValue: '0.9563615332000001'
           vduName: test_fet7912-2-ubuntuvnf2vdu1-1
           vnfMemberIndex: '2'
       timestamp: 1568977549.065
4) Interacting with Prometheus directly through its API
The Prometheus HTTP API is always directly available to gather any metrics. A couple of examples are shown below:
Example with Date range query
curl 'http://localhost:9091/api/v1/query_range?query=osm_cpu_utilization&start=2018-12-03T14:10:00.000Z&end=2018-12-03T14:20:00.000Z&step=15s'
Example with Instant query
curl 'http://localhost:9091/api/v1/query?query=osm_cpu_utilization&time=2018-12-03T14:14:00.000Z'
Further examples and API calls can be found at the Prometheus HTTP API documentation.
5) Interacting directly with MON Collector
The way Prometheus TSDB stores metrics is by querying Prometheus ‘exporters’ periodically, which are set as ‘targets’. Exporters expose current metrics in a specific format that Prometheus can understand, more information can be found here
OSM MON features a “mon-exporter” module that exports current metrics through port 8000. Please note that this port is by default not being exposed outside the OSM docker’s network.
A tool that understands Prometheus ‘exporters’ (for example, Elastic Metricbeat) can be plugged-in to integrate directly with “mon-exporter”. To get an idea on how metrics look alike in this particular format, you could:
1. Get into MON console
docker exec -ti osm_mon.1.[id] bash
2. Install curl
apt -y install curl
3. Use curl to get the current metrics list
curl localhost:8000
Please note that as long as the Prometheus container is up, it will continue retrieving and storing metrics in addition to any other tool/DB you connect to mon-exporter.
6) Using your own TSDB
OSM MON integrates Prometheus through a plugin/backend model, so if desired, other backends can be developed. If interested in contributing with such option, you can ask for details at our Slack #service-assurance channel or through the OSM Tech mailing list.
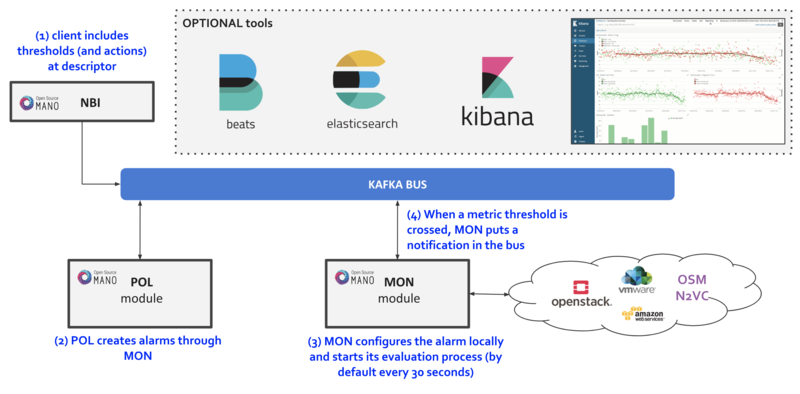
Fault Management
Reference diagram:
Basic functionality
Logs & Events
Logs can be monitored on a per-container basis via command line, like this:
docker logs <container id or name>
For example:
docker logs osm_lcm.1.tkb8yr6v762d28ird0edkunlv
Logs can also be found in the corresponding volume of the host filesystem: /var/lib/containers/[container-id]/[container-id].json.log
Furthermore, there are some important events flowing between components through the Kafka bus, which can be monitored on a per-topic basis by external tools.
Alarm Manager for Metrics
As of Release FIVE, MON includes a new module called ‘mon-evaluator’. The only use case supported today by this module is the configuration of alarms and evaluation of thresholds related to metrics, for the Policy Manager module (POL) to take actions such as auto-scaling.
Whenever a threshold is crossed and an alarm is triggered, the notification is generated by MON and put in the Kafka bus so other components, like POL can consume them. This event is today logged by both MON (generates notification) and POL (consumes notification, for its auto-scaling or webhook actions)
By default, threshold evaluation occurs every 30 seconds. This value can be changed by setting an environment variable, for example:
docker service update --env-add OSMMON_EVALUATOR_INTERVAL=15 osm_mon
To configure alarms that send webhooks to a web service, add the following to the VNF descriptor:
vdu:
-   alarm:
    -   alarm-id: alarm-1
        operation: LT
        value: 20
        actions:
          alarm:
            - url: https://webhook.site/1111
          ok:
            - url: https://webhook.site/2222
          insufficient-data:
            - url: https://webhook.site/3333
        vnf-monitoring-param-ref: vnf_cpu_util
Regarding how to configure alarms through VNFDs for the auto-scaling use case, follow the auto-scaling documentation