19. OSM Reference
19.1. Service Assurance Architecture
Since OSM Release THIRTEEN, OSM offers a scalable architecture for Service Assurance (SA) based on Apache Airflow and Prometheus, which includes closed loops for auto-scaling and the handling of alerts coming from the Network Functions.
19.1.1. Goal and principles of the Service Assurance architecture
The main goal of the Service Architecture is to sense the state of the objects deployed by OSM and build telco cloud use cases with that information:
Offering state indicators of the NS and their components, as well as the NFV infrastructure used by OSM.
Providing capabilities to build closed-loops for scaling and healing
Metric visualization is not a main objective for the E2E Service Assurance architecture. While OSM provides visualization of the collected and derived metrics, it will always serve for the purpose of building advanced use cases.
The principles of the Service Assurance archicture are:
Do not reinvent the wheel. Instead of building a new framework from scratch, OSM relies on well-known open source projects such as Prometheus Apache Airflow, respectively for the storage and handling of metrics and alerts, and the execution of workflows.
Modularity of tasks. Workflows must be split into smaller stages that should be run by the most appropriate component. Similary to the ETL paradigm in data analytics pipelines, inputs could come from anywhere, being processed by any component and outputs could go everywhere.
Scalability. Task execution must be prepared to run in parallel, so that a collection of workers can run potentially any task, maximizing workload sharing between workers. This also avoids dedicated components for specific tasks. Bottlenecks can be globally managed by scaling the number of workers.
Configurable schedule of workflows. This is specially important for metric collection, which could be very intensive in resource consumption.
Easy to add new capabilities. The selected components provide a toolkit to easily incorporate new functionality, lowering the learning curve.
19.1.2. Building blocks
Service Assurance architecture in OSM is characterized by the following:
It relies on Apache Airflow and Prometheus stack as main building blocks. Prometheus TSDB and Grafana were already deployed in previous releases of OSM. Since Release THIRTEEN and FOURTEEN, Airflow, Prometheus AlertManager and PushGateway are also deployed.
It deprecates the use of the old components MON and POL. With the new SA architecture, POL is removed, while the role of MON is restricted to a process to create Grafana dashboards per project and NS.
Metrics are gathered by dedicated and scheduled workflows running in Airflow
Enhanced metrics per NS or VNF can be derived in Prometheus from the collected metrics
Closed-loops for scaling and healing are triggered by alerts generated by Prometheus Alert Manager, and conveniently addressed to Airflow endpoints to run the associated workflows.
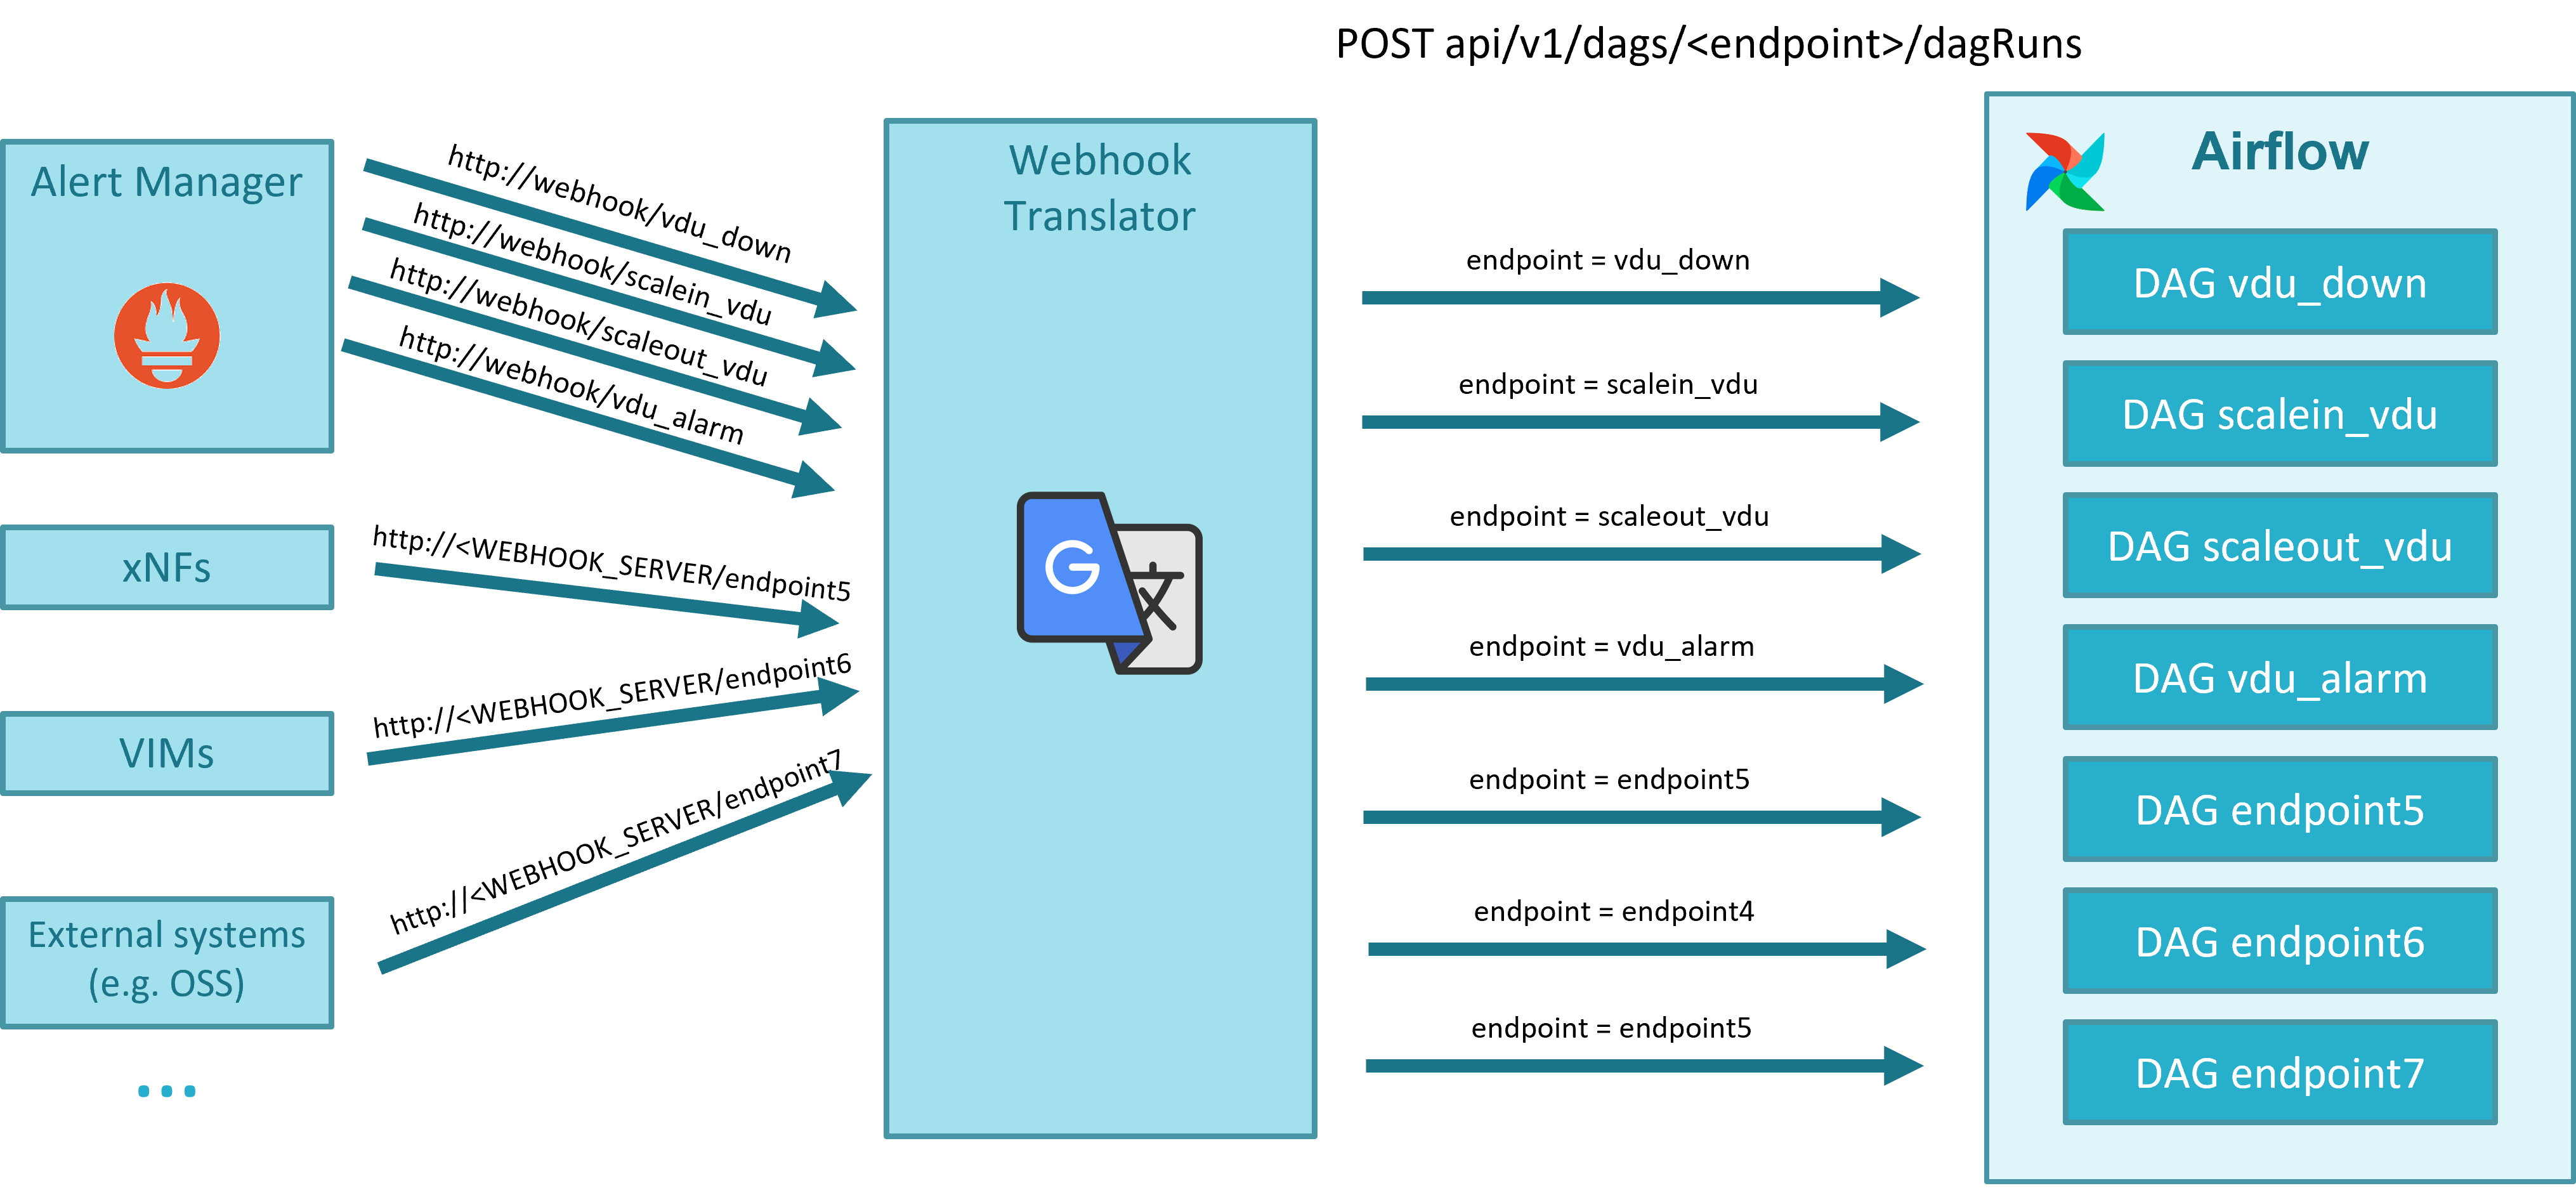
Webhook Translator is a new component that has been added to translate webhooks, allowing the translation of an alert generated by Alert Manager to the appropriate Airflow DAG endpoint, and enabling the capability to translate in the future external alerts from VNF or other systems to dedicated Airflow workflows.
19.1.2.1. Apache Airflow
Apache Airflow is an open-source workflow management platform for data engineering pipelines. It started at Airbnb in October 2014 as a solution to manage the company’s increasingly complex workflows. Creating Airflow allowed Airbnb to programmatically author and schedule their workflows and monitor them via the built-in Airflow user interface. From the beginning, the project was made open source, becoming an Apache Incubator project in March 2016 and a top-level Apache Software Foundation project in January 2019.
Airflow is written in Python, and workflows are created via Python scripts. Airflow is designed under the principle of “configuration as code”. While other “configuration as code” workflow platforms exist using markup languages like XML, using Python allows developers to import libraries and classes to help them create their workflows.
Airflow provides a mechanism to run scheduled workflows as well as workflows on demand from an alert. Workflows, called DAGs, are devided in tasks which are run by workers, convenient triggered by the scheduler. In addition, Airflow provides a suitable web-based UI which allows to enable/disable, monitor and log the execution of DAGs.
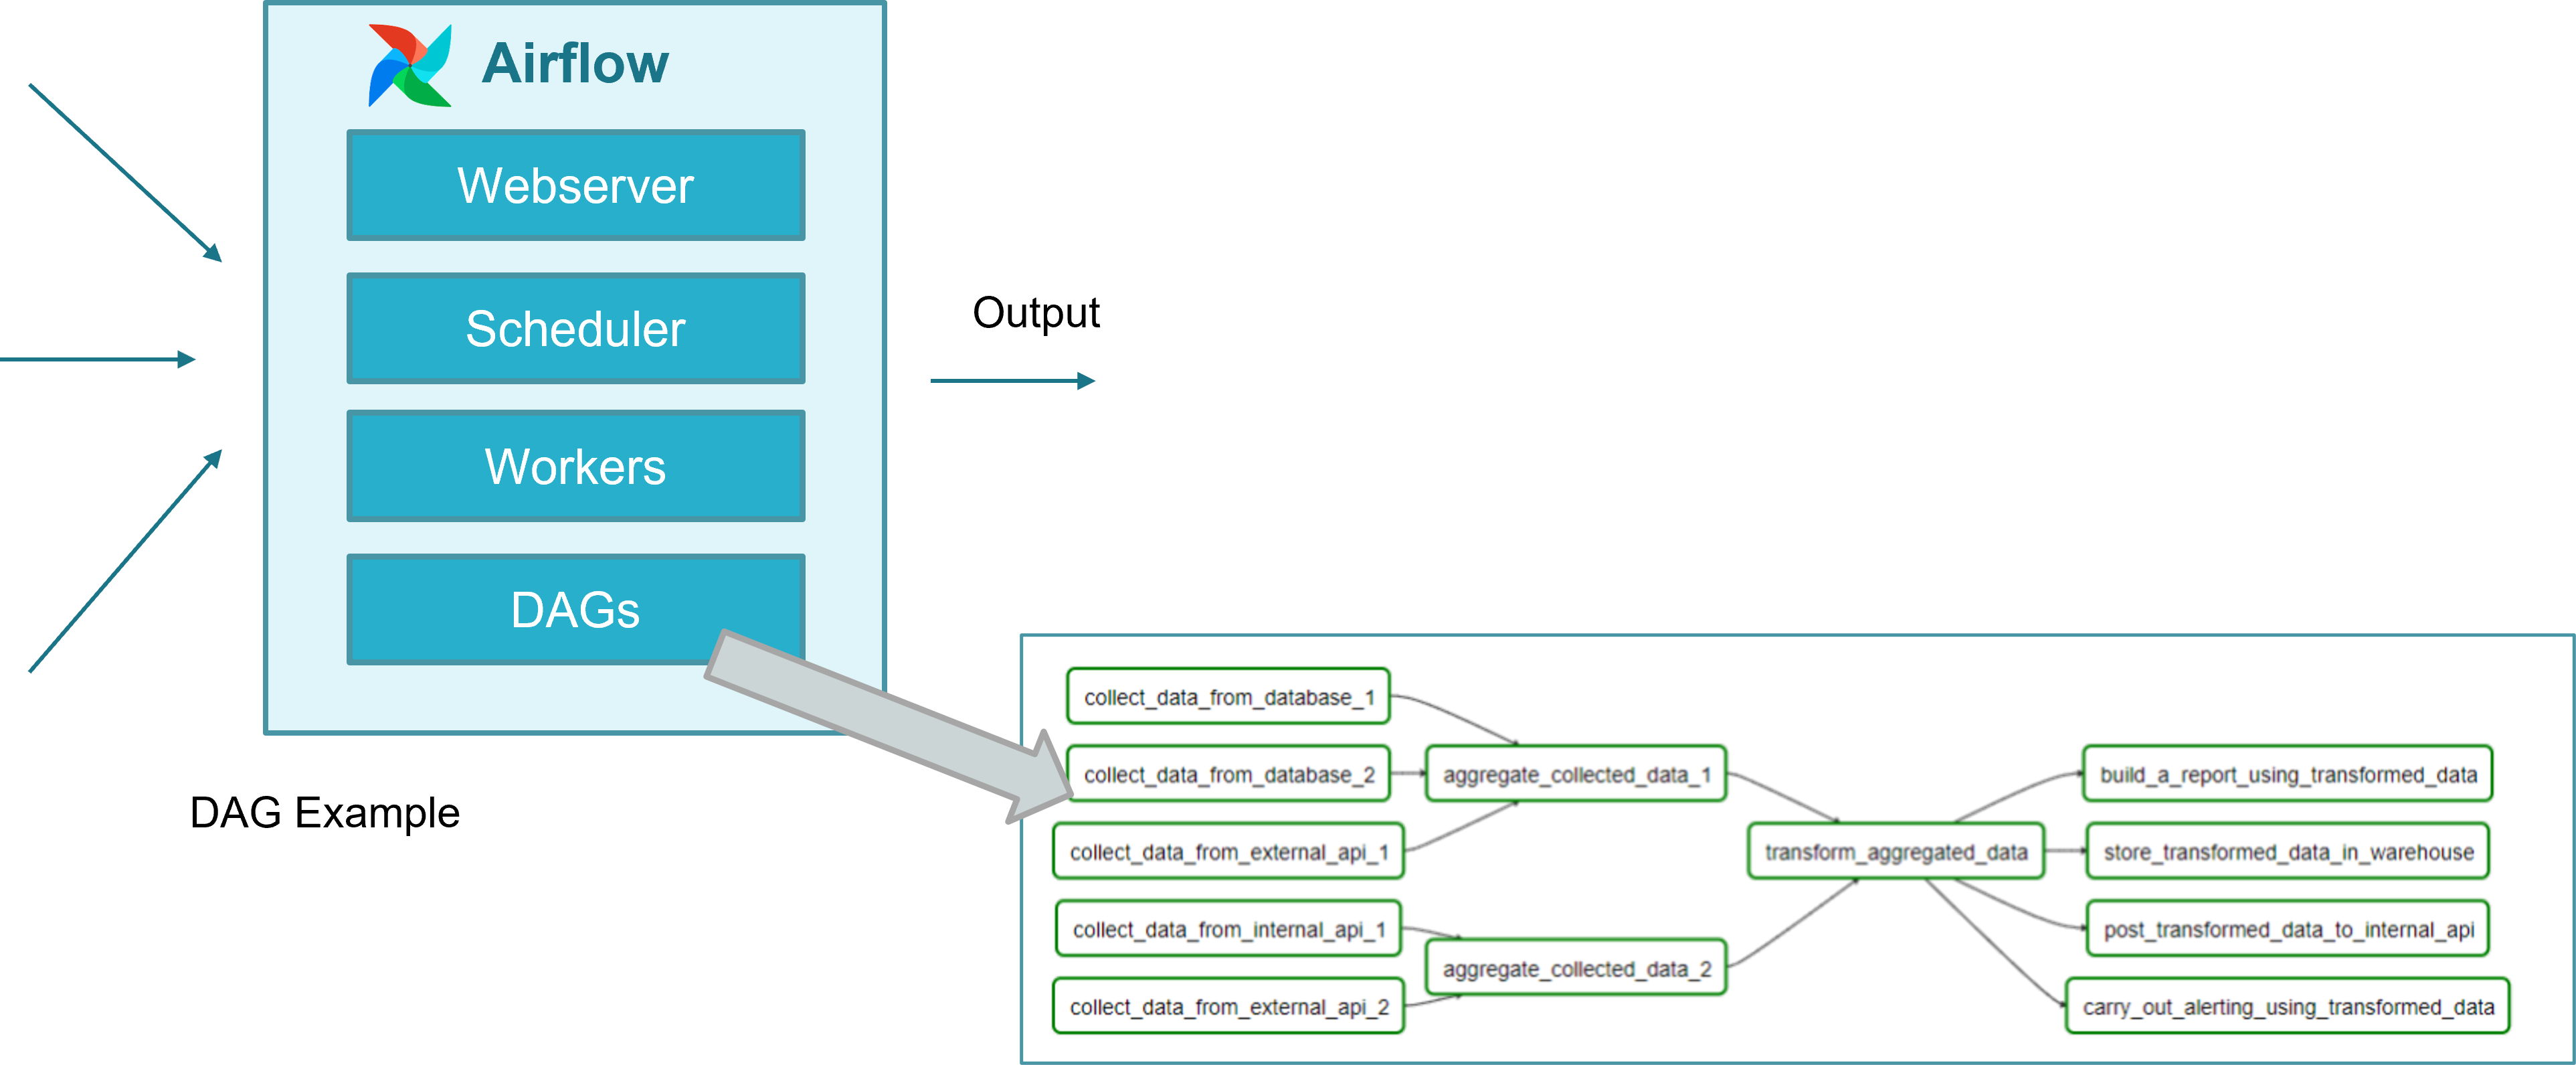
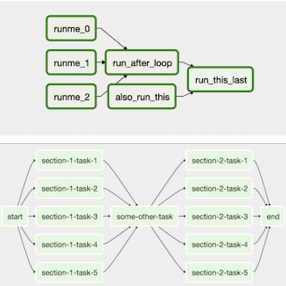
The way to model workflows in Airflow is via Directed Acyclic Graphs (DAG). A DAG is a collection of all the tasks you want to run, organized in a way that reflects their relationships and dependencies. A DAG is defined in a Python script, which represents the DAG structure (tasks and their dependencies) as code. For example, a simple DAG could consist of three tasks: A, B, and C. It could say that A has to run successfully before B can run, but C can run anytime. It could say that task A times out after 5 minutes, and B can be restarted up to 5 times in case it fails. It might also say that the workflow will run every night at 10pm but shouldn’t start until a certain date.
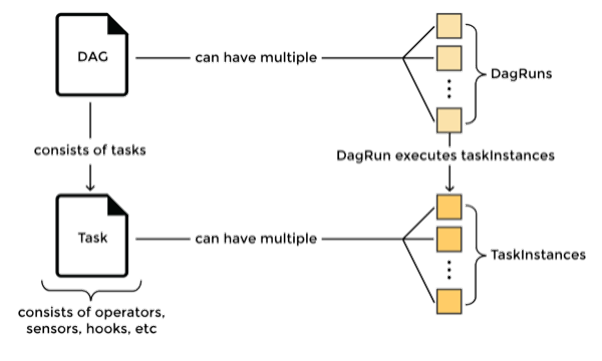
In summary a DAG is:
A collection of tasks, with flexibility to create dependencies between tasks
Defined in Python
DAGs can be dynamically created, for instance one per VIM or one per Network Service
Tasks can be dynamically created inside a DAG, for instance
Airflow DAGs are designed to scale since a collection of Airflow workers can run tasks in parallel
Airflow DAGs can be scheduled independently
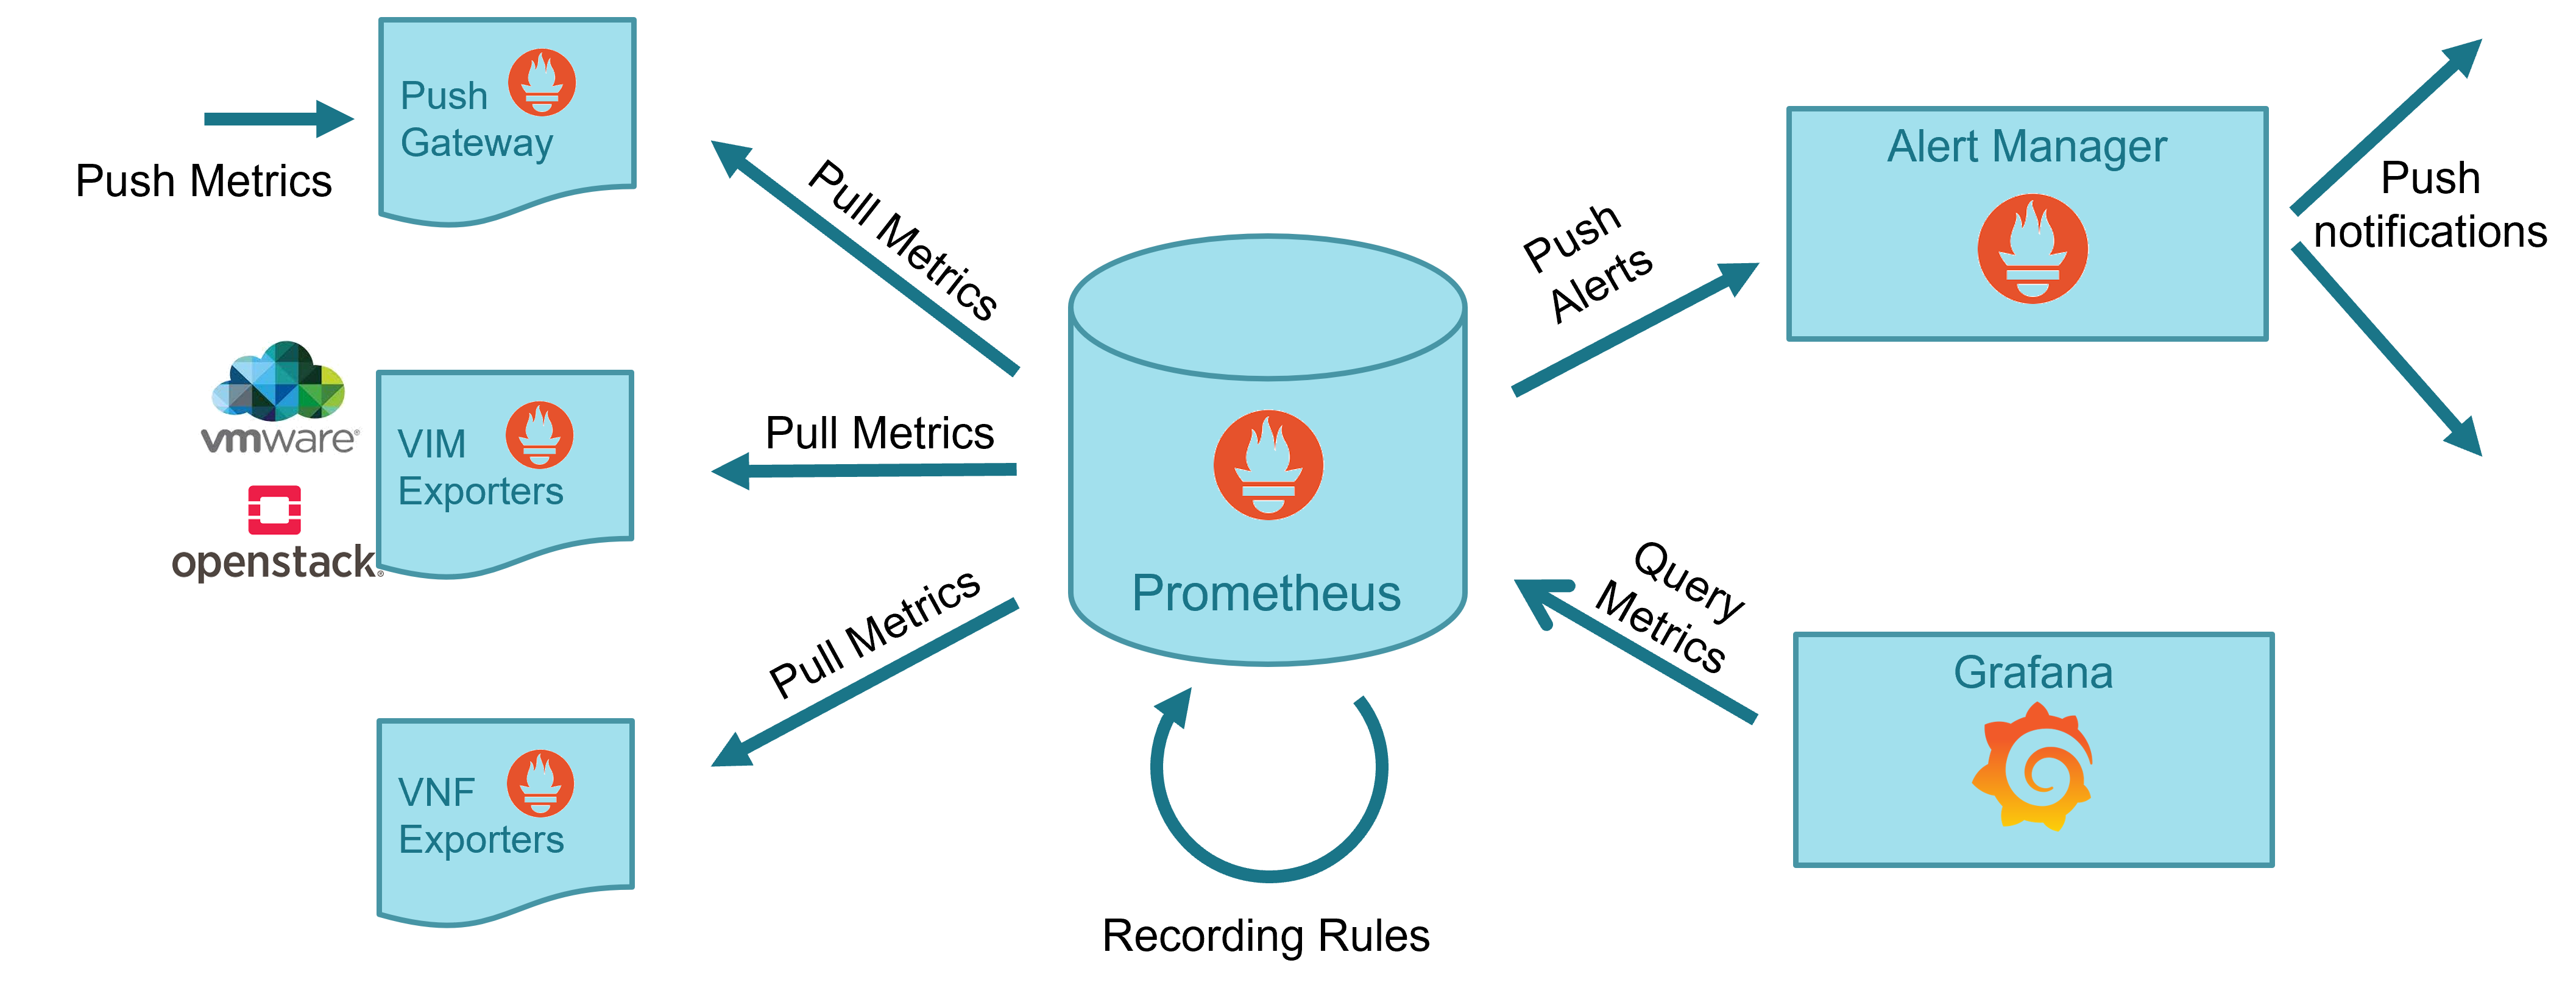
19.1.2.2. Prometheus Stack
Prometheus is a well-known complete open-source framework for monitoring, including metric collection and storage in a time-series database, following an HTTP pull model, metric query via HTTP with a dedicated language PromQL, metric derivation, alert generation and management, and metric visualization.
19.1.2.3. Webhook Translator
The Webhook Translator a new component that has been added to translate webhooks, allowing the translation of an alert generated by Alert Manager to the appropriate Airflow DAG endpoint, and enabling the capability to translate in the future external alerts from VNF or other systems to dedicated Airflow workflows.
It is lightweight. A very small number of lines of code does the work.
It is stateless. It only translates HTTP requests. No state for those translations. When running as a deployment, native scaling is achieved by means of Kubernetes services.
It is simple. It is based on FastAPI, a simple and fast framework for developing an HTTP REST API in Python.
It is independent from the source of the alert.
No maintenance is expected.
The code of the webhook can be found in Gerrit and in Gitlab.
19.1.3. Metric acquisition and derivation
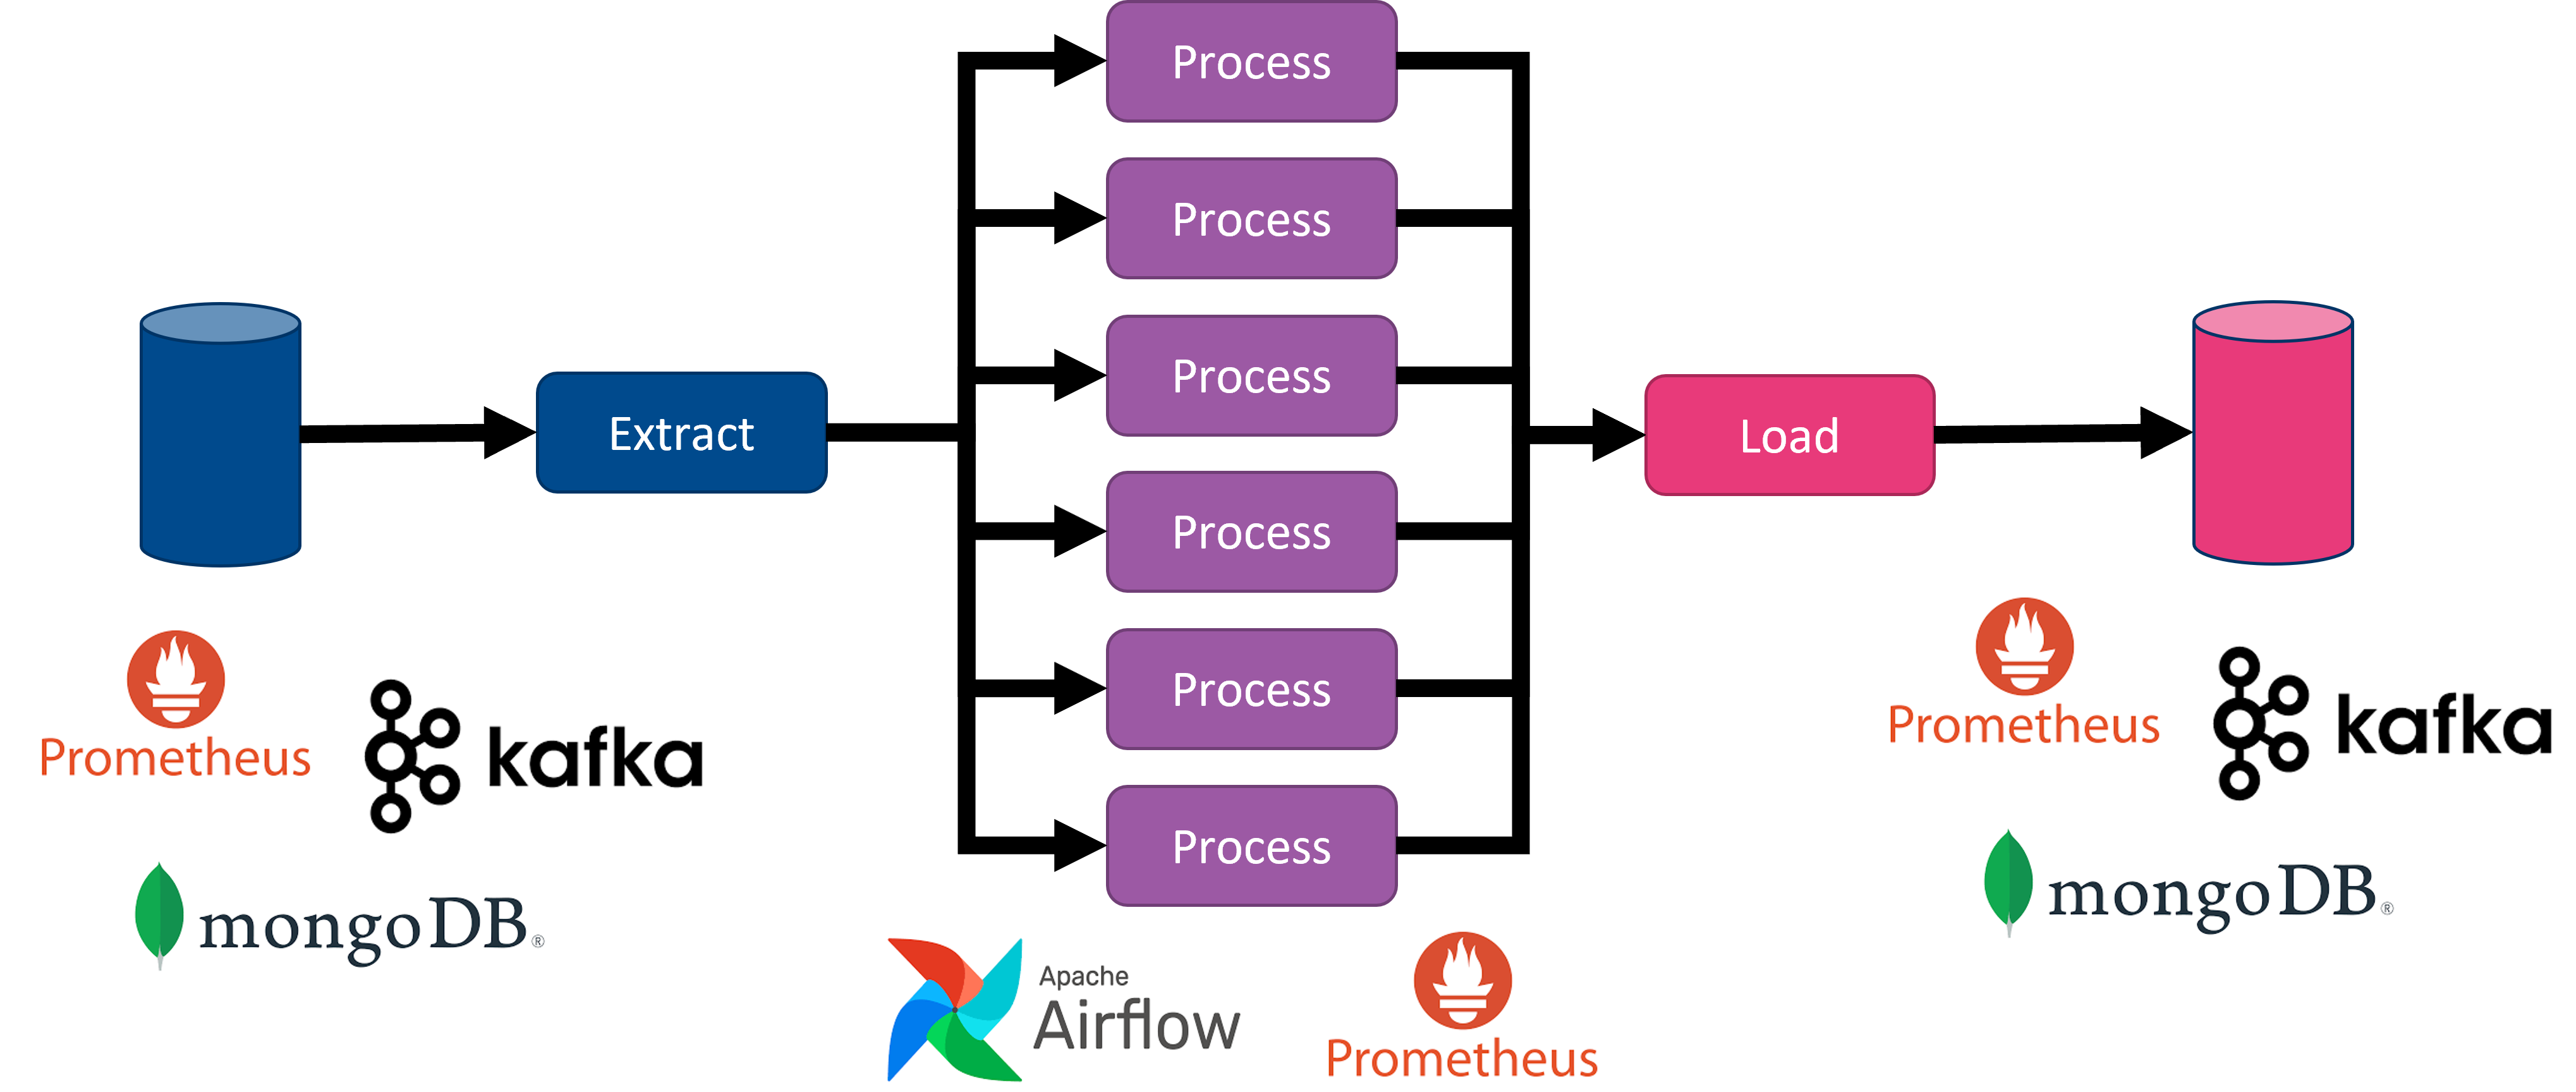
The following figure illustrates the general workflow for metric acquisition and derivation.
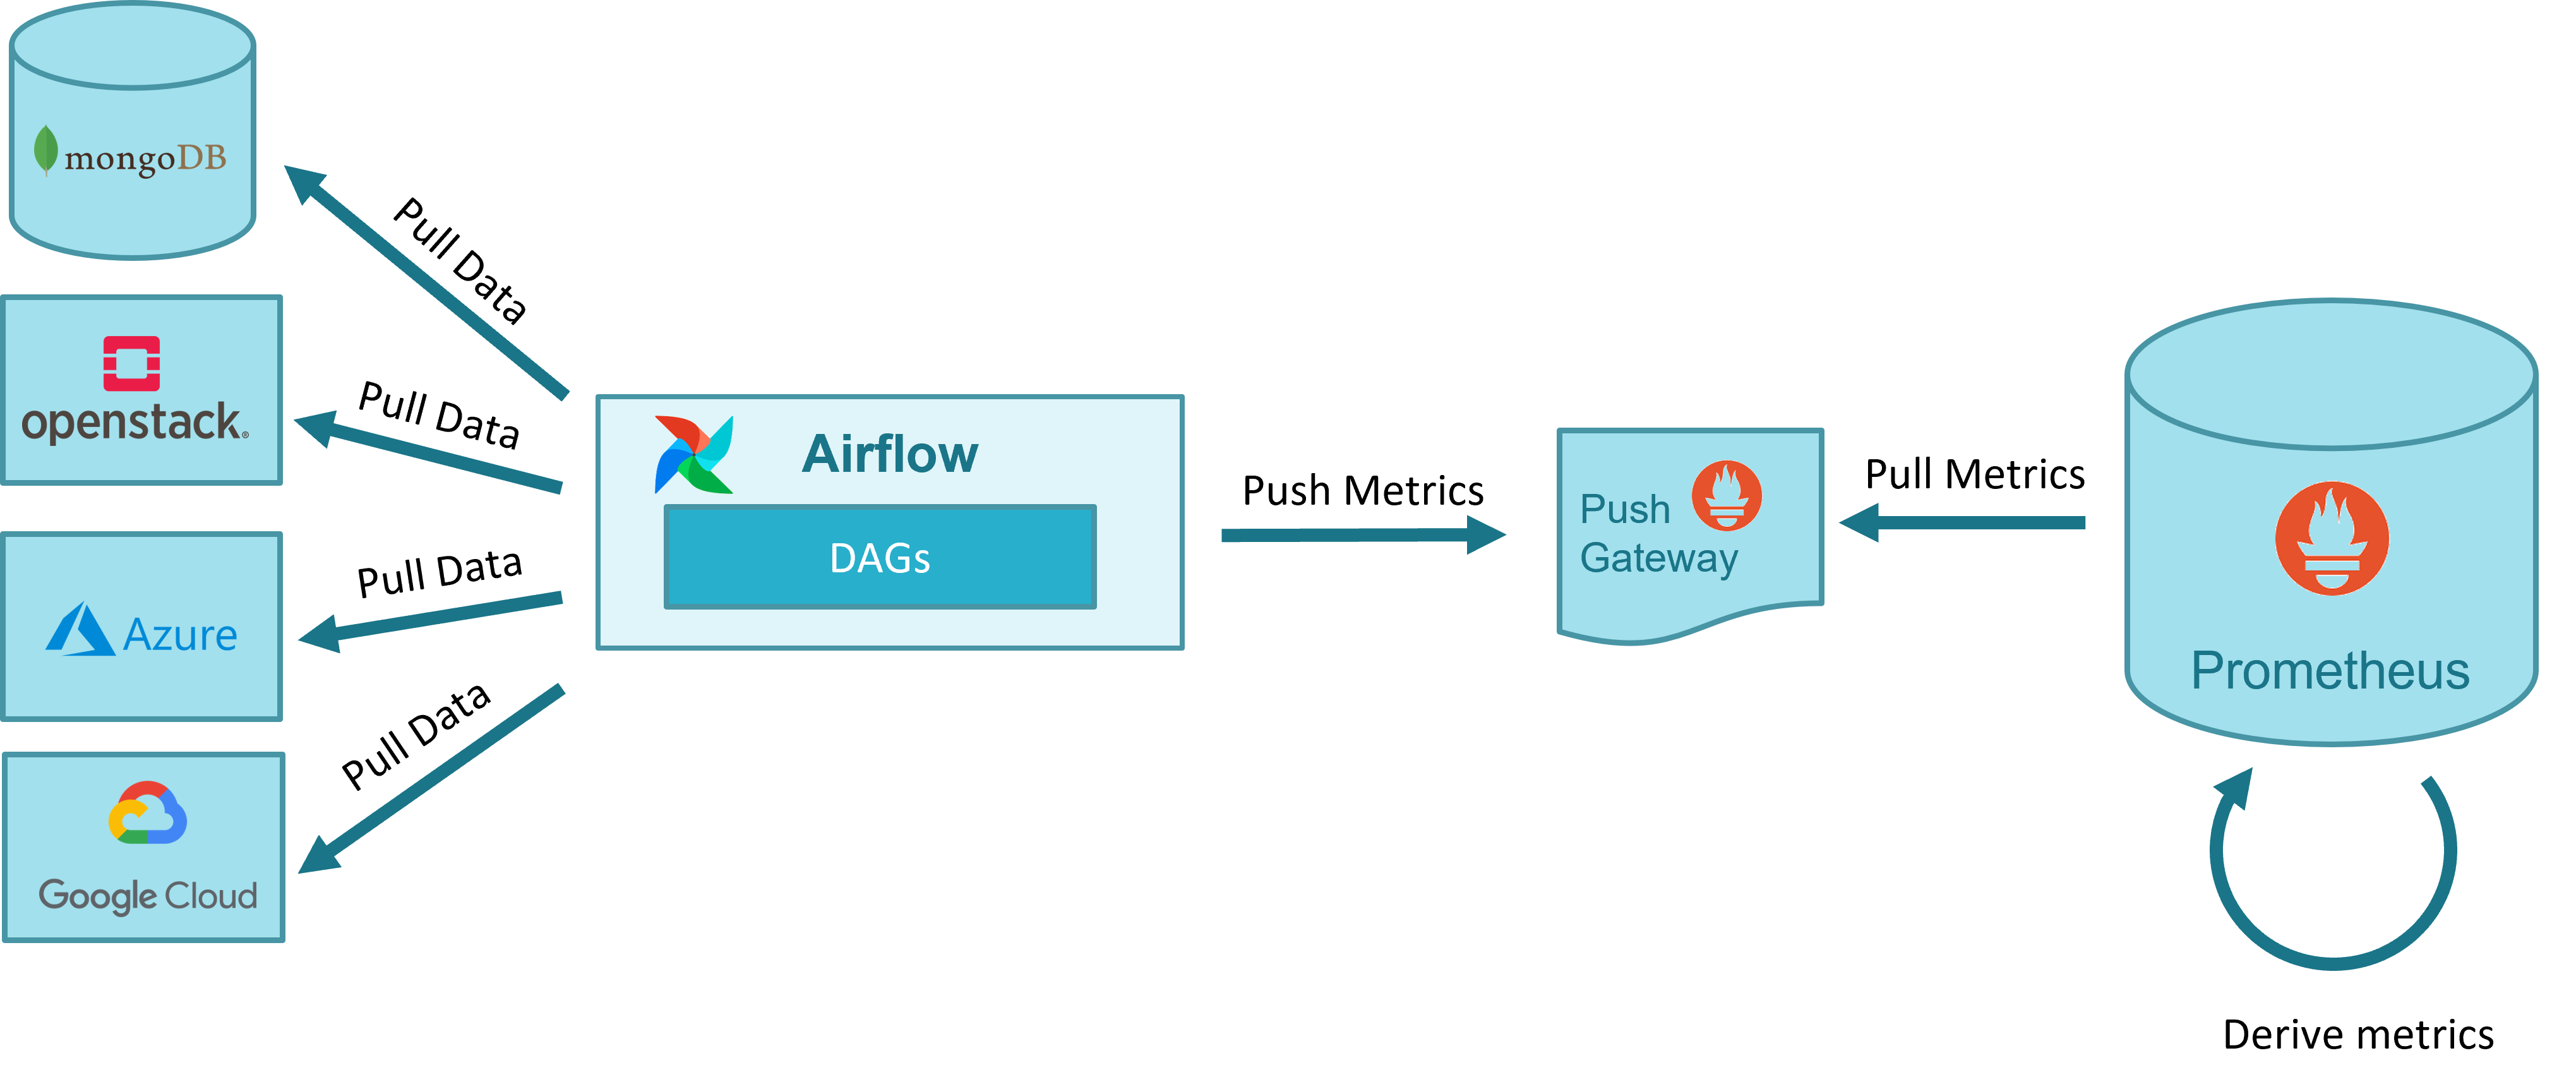
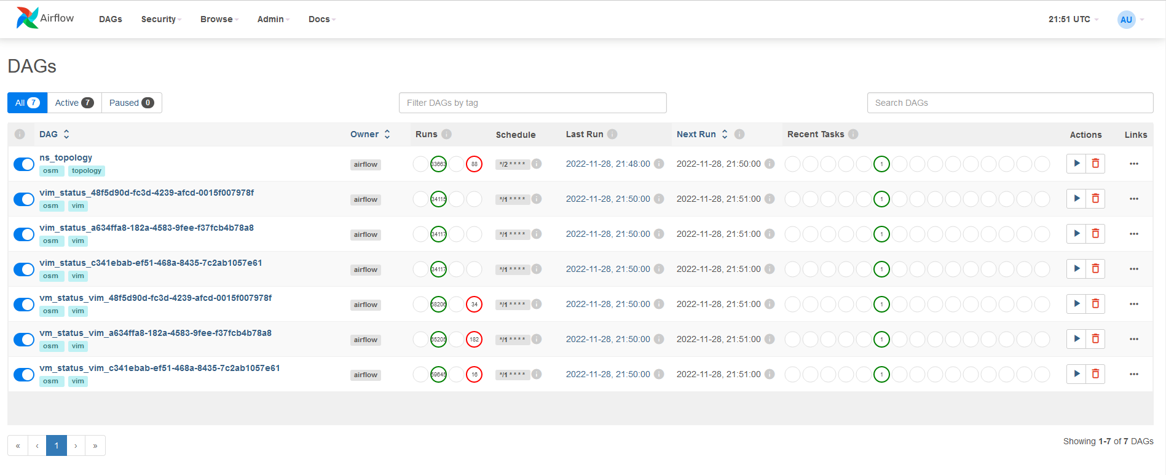
Metrics are acquired in OSM with dedicated Airflow DAGs. In some cases, such as for the obtention of the NS topologies, a single DAG is used. For other cases such as the gathering of the VIM status, the VM status and the VM resource consumption metrics, a DAG per VIM is used. The following figure shows a screenshot of the DAGs as shown by Airflow UI.
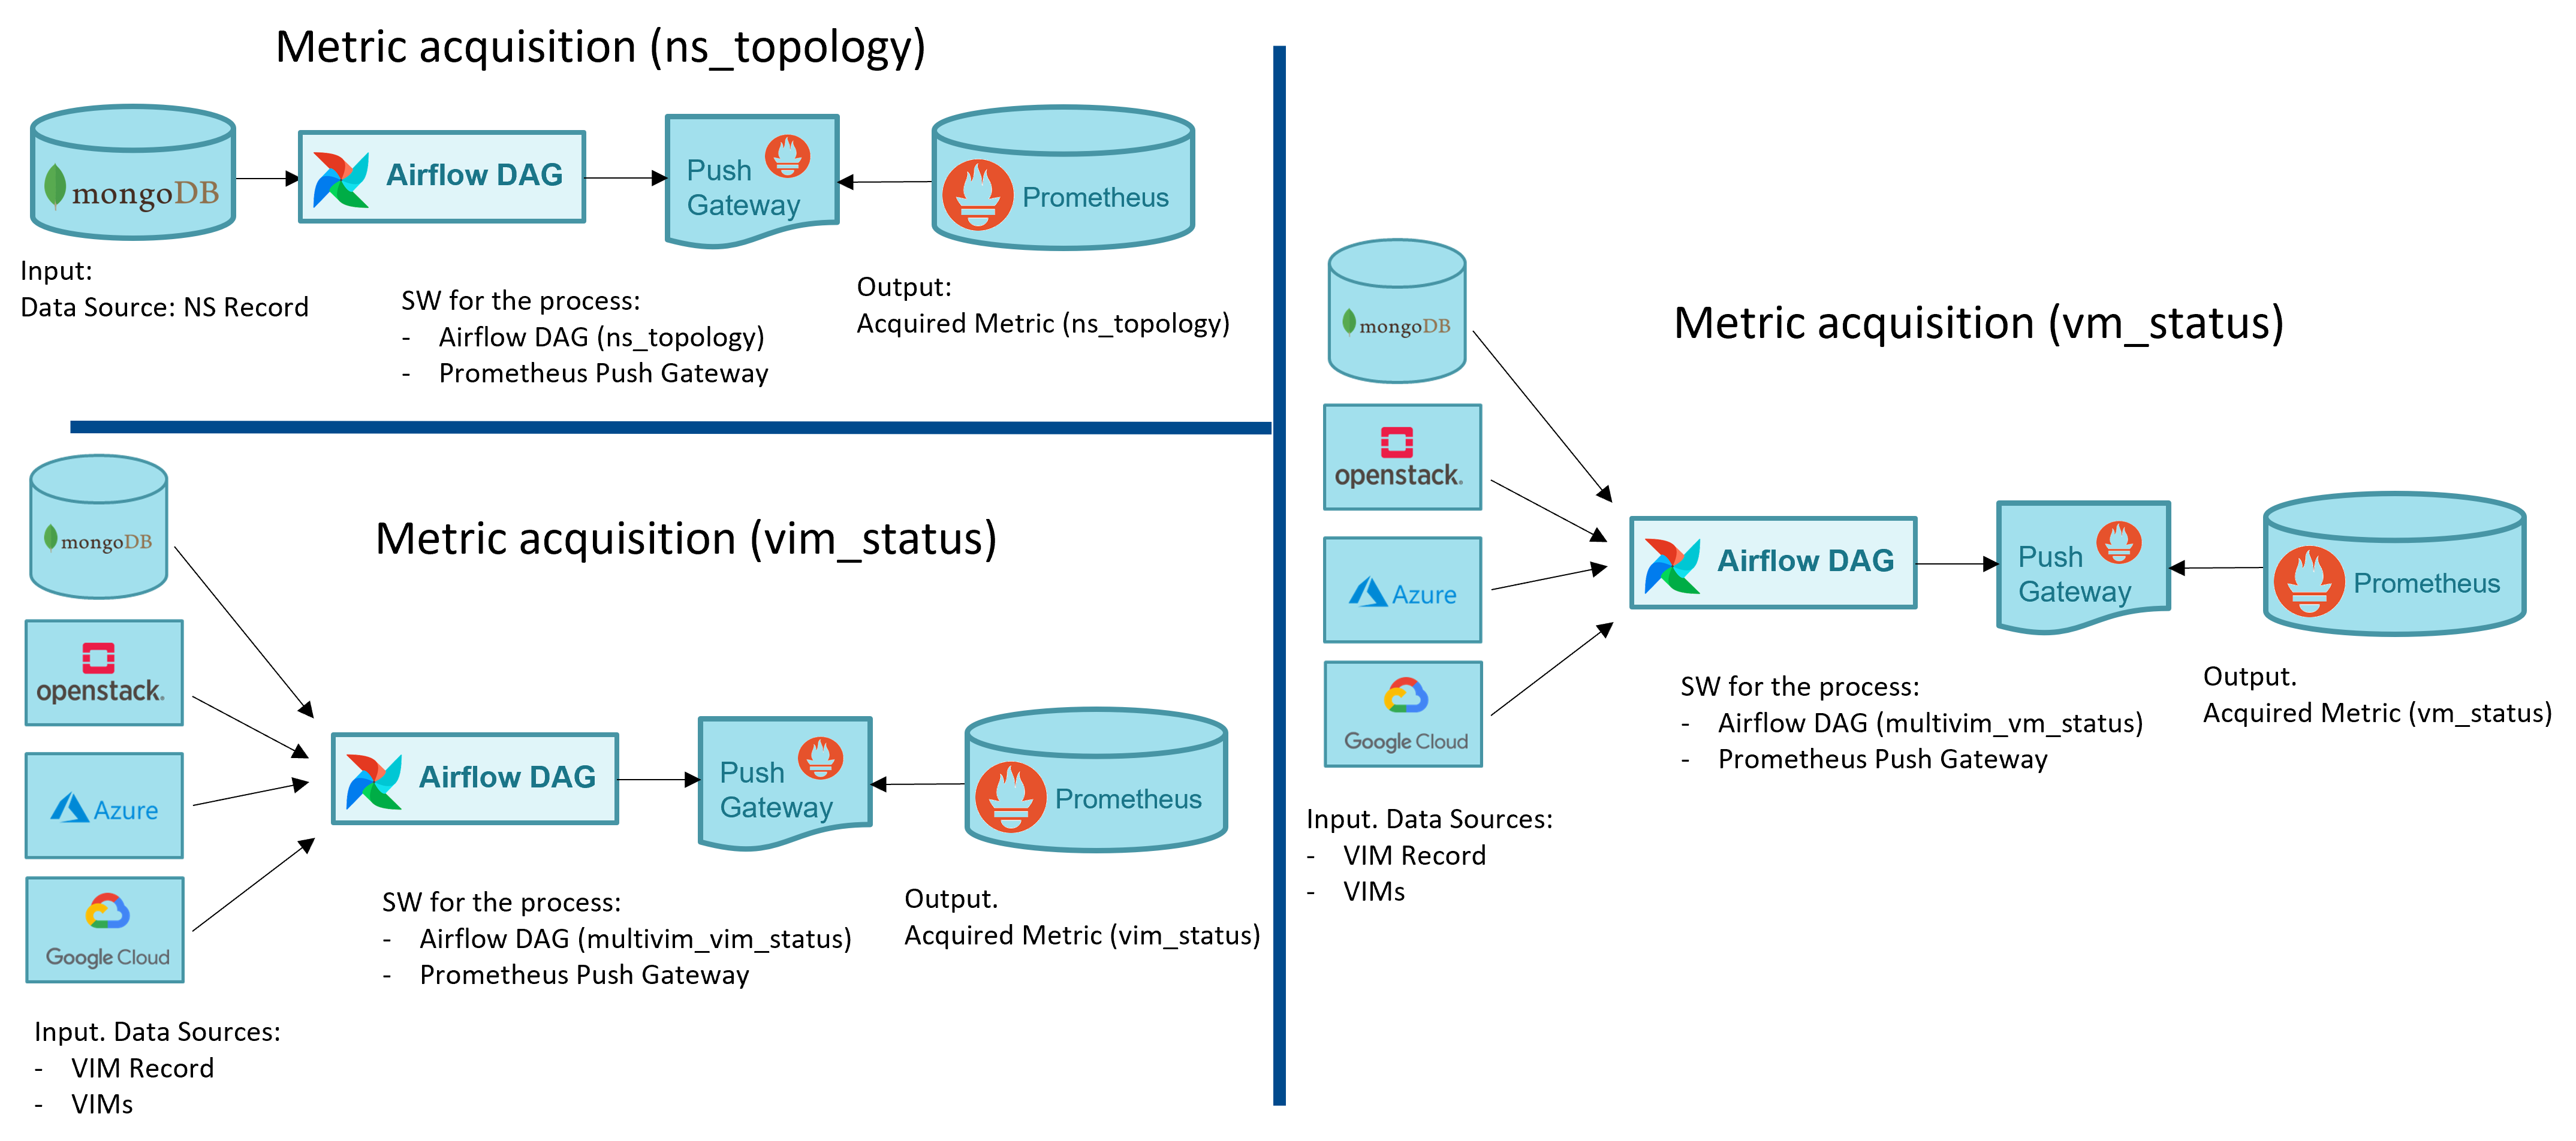
Below a summary of the metrics acquired by OSM, summarizing its input, output and the software used for the process.
NS topology:
From Mongo DB to Prometheus
Software used to acquire the metric: Airflow DAG + Prometheus PushGateway
VM status:
From MongoDB and VIM to Prometheus
Software used to acquire the metric: Airflow DAG per VIM + Prometheus PushGateway
VIM status
From MongoDB and VIM to Prometheus
Software used to acquire the metric: Airflow DAG per VIM + Prometheus PushGateway
VM metrics (resource consumption)
From MongoDB and VIM to Prometheus
Software used to acquire the metric: Airflow DAG per VIM + Prometheus PushGateway
The following figure illustrates graphically the specific workflows for metric acquisition.
Regarding to resource consumption metrics, three types of VIM are currently supported: Openstack (Gnocchi and Ceilometer back-ends), Azure and GCP. The metrics that OSM can collect from the VNFs deployed in those VIMs are shown in the table below:
| Metric | Openstack | Azure | GCP |
|---|---|---|---|
| osm_cpu_utilization | X | X | X |
| osm_average_memory_utilization | X | X | |
| osm_disk_read_ops | X | X | X |
| osm_disk_write_ops | X | X | X |
| osm_disk_read_bytes | X | X | X |
| osm_disk_write_bytes | X | X | X |
| osm_packets_in_dropped | X | ||
| osm_packets_out_dropped | X | ||
| osm_packets_received | X | X | |
| osm_packets_sent | X | X |
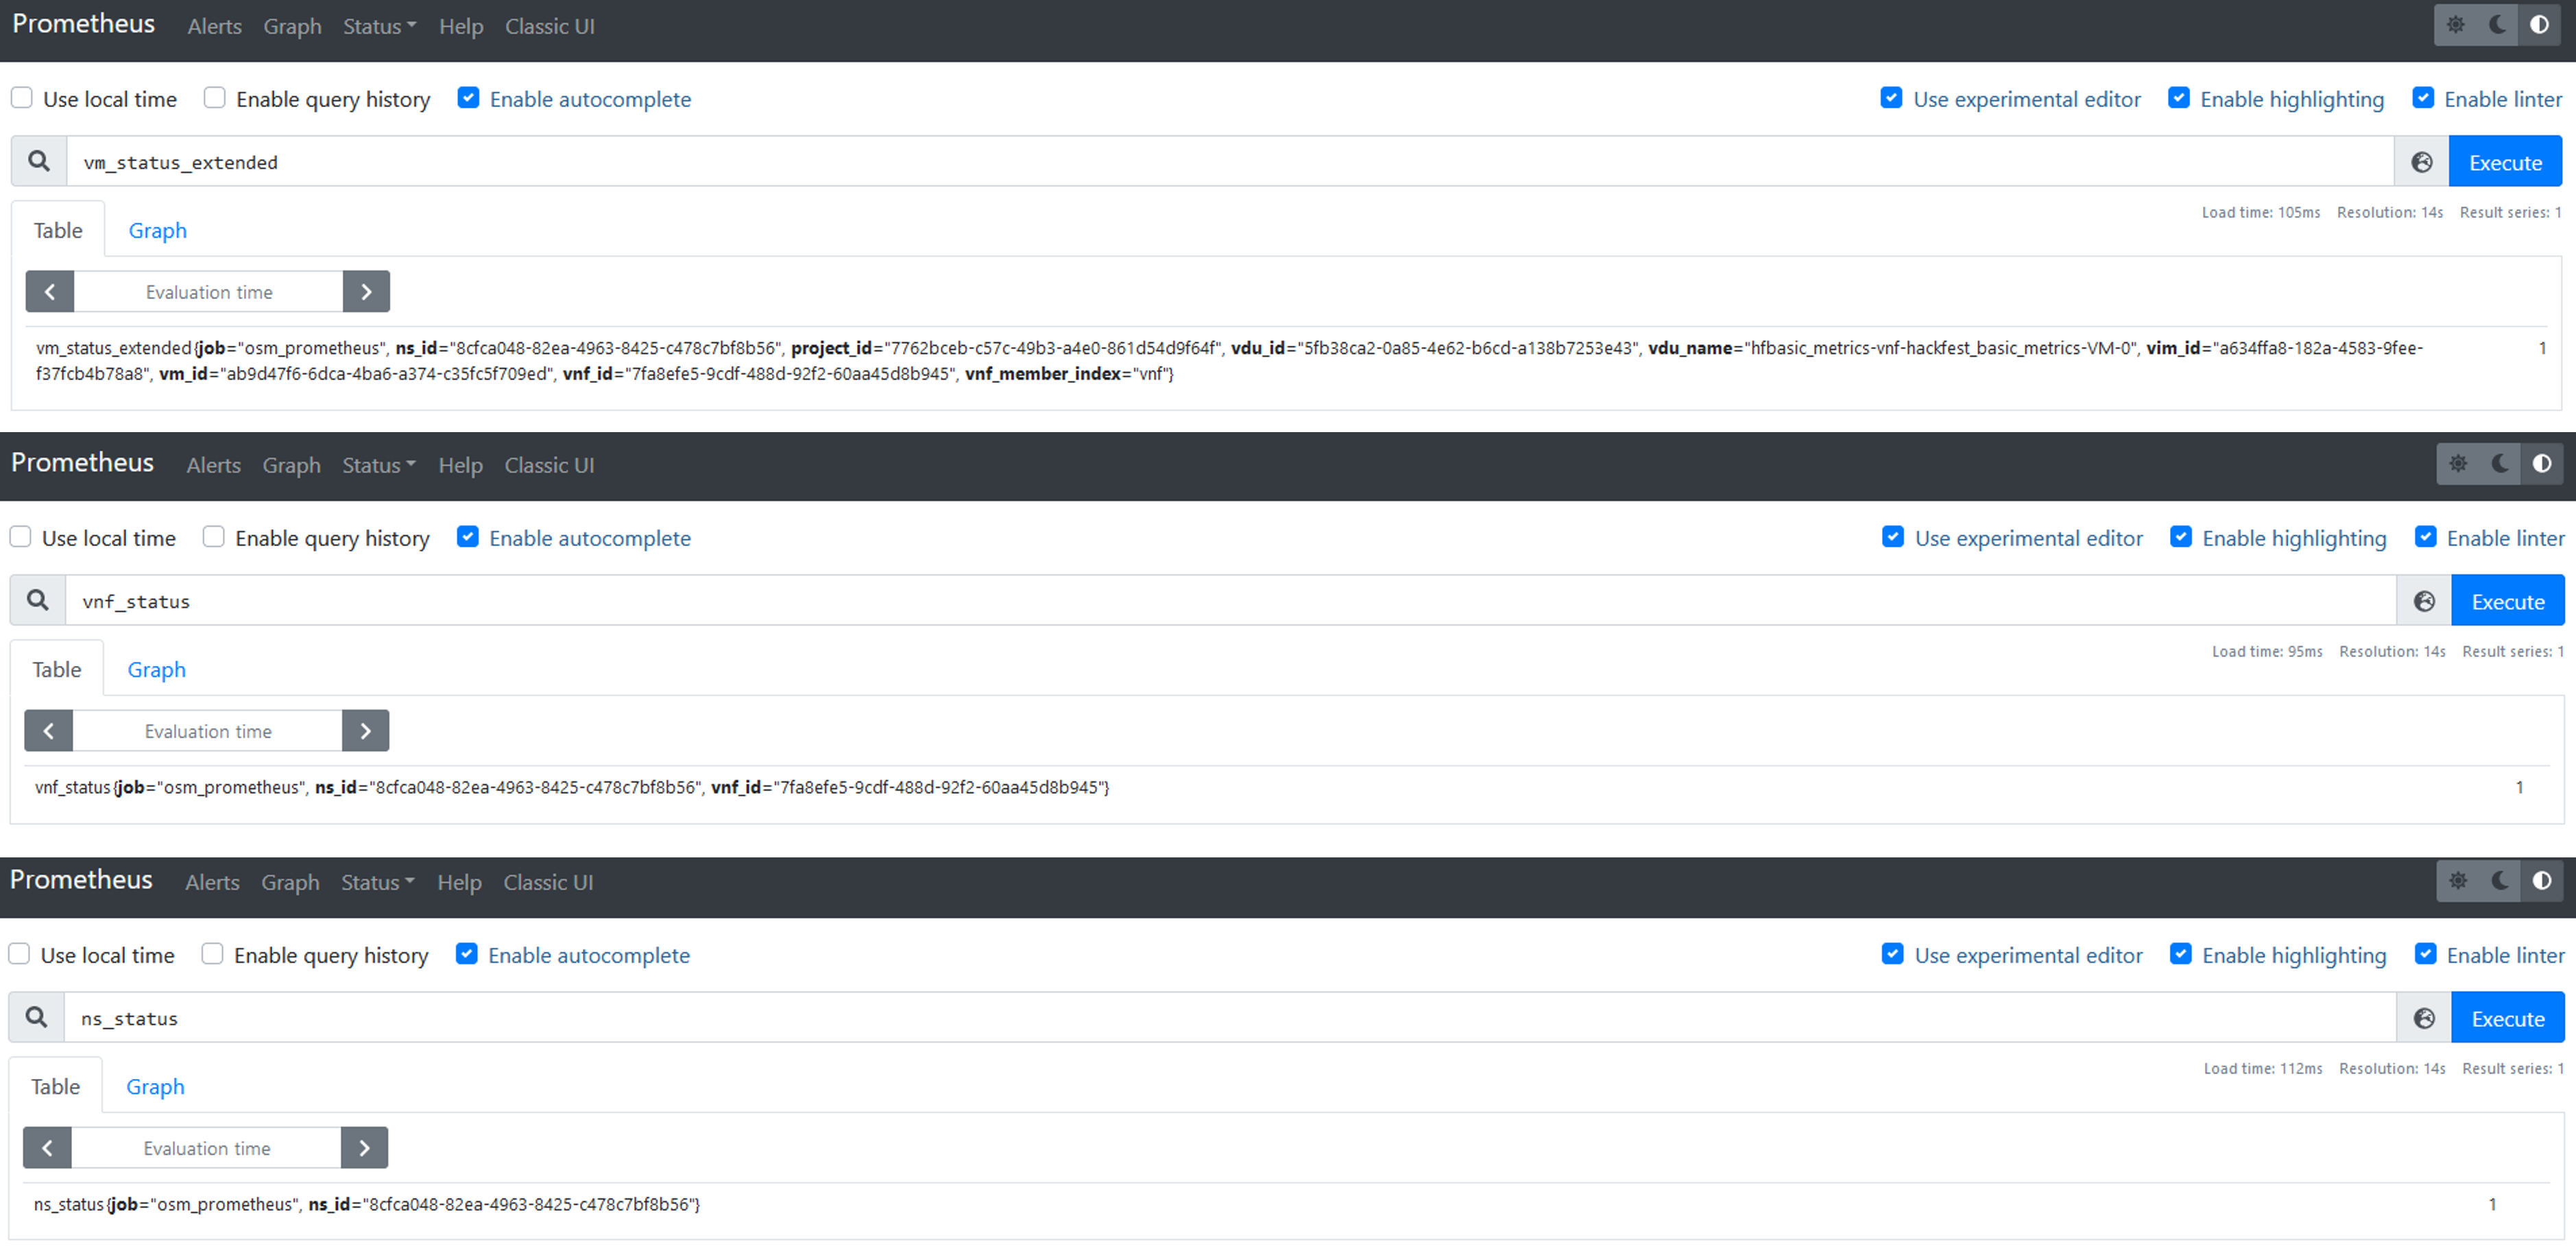
The metrics, as acquired by OSM, might not be useful per-se, since they are not related to OSM objects. For instance, the VM status or the VM resource consumption metrics are only useful when they relate to a VNF instance or a NS instance. Prometheus recording rules allow to derive metrics from existing metrics, computing them and saving the result as a new set of time series. The following figure shows a screenshot of the metrics derived in Prometheus.
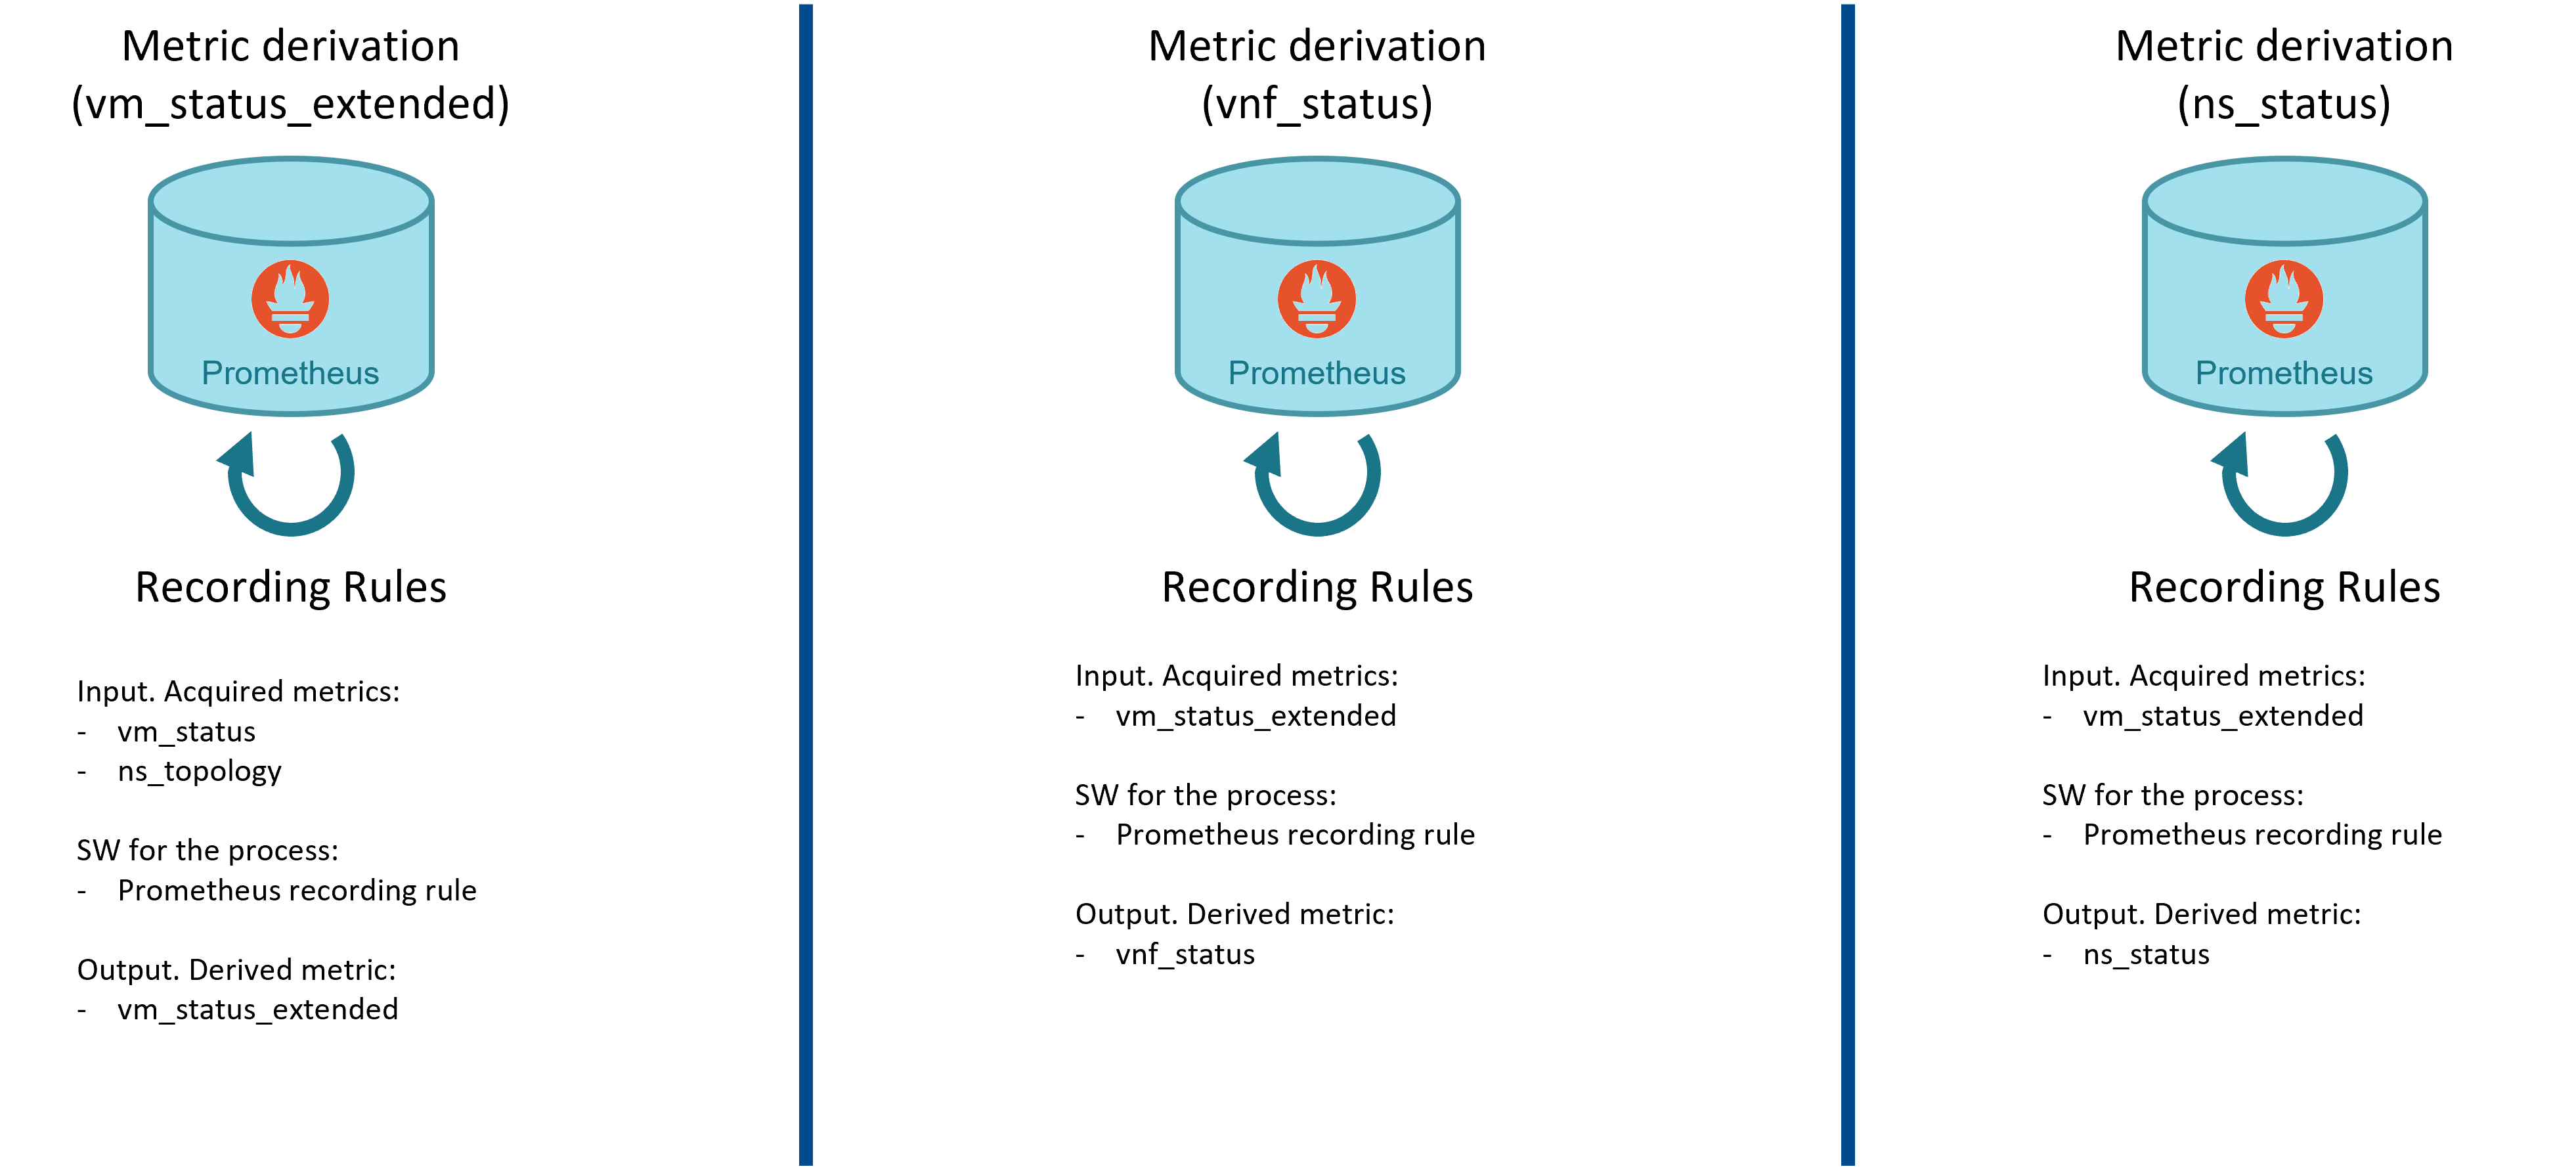
Below a summary of the metrics derived by OSM, summarizing its input, output and the software used for the process.
Extended VM status:
From Prometheus (NS topology, VM status) to Prometheus
Software used to derive the metric: Prometheus Recording Rules
VNF status:
From Prometheus (Extended VM status) to Prometheus
Software used to derive the metric: Prometheus Recording Rules
NS status:
From Prometheus (Extended VM status) to Prometheus
Software used to derive the metric: Prometheus Recording Rules
Finally, the following figure summarizes graphically the specific workflows for metric derivation.
19.1.4. Closed loops in OSM
The following figure illustrates the general workflow for closed-loops in OSM that is used both for auto-healing and auto-scaling.
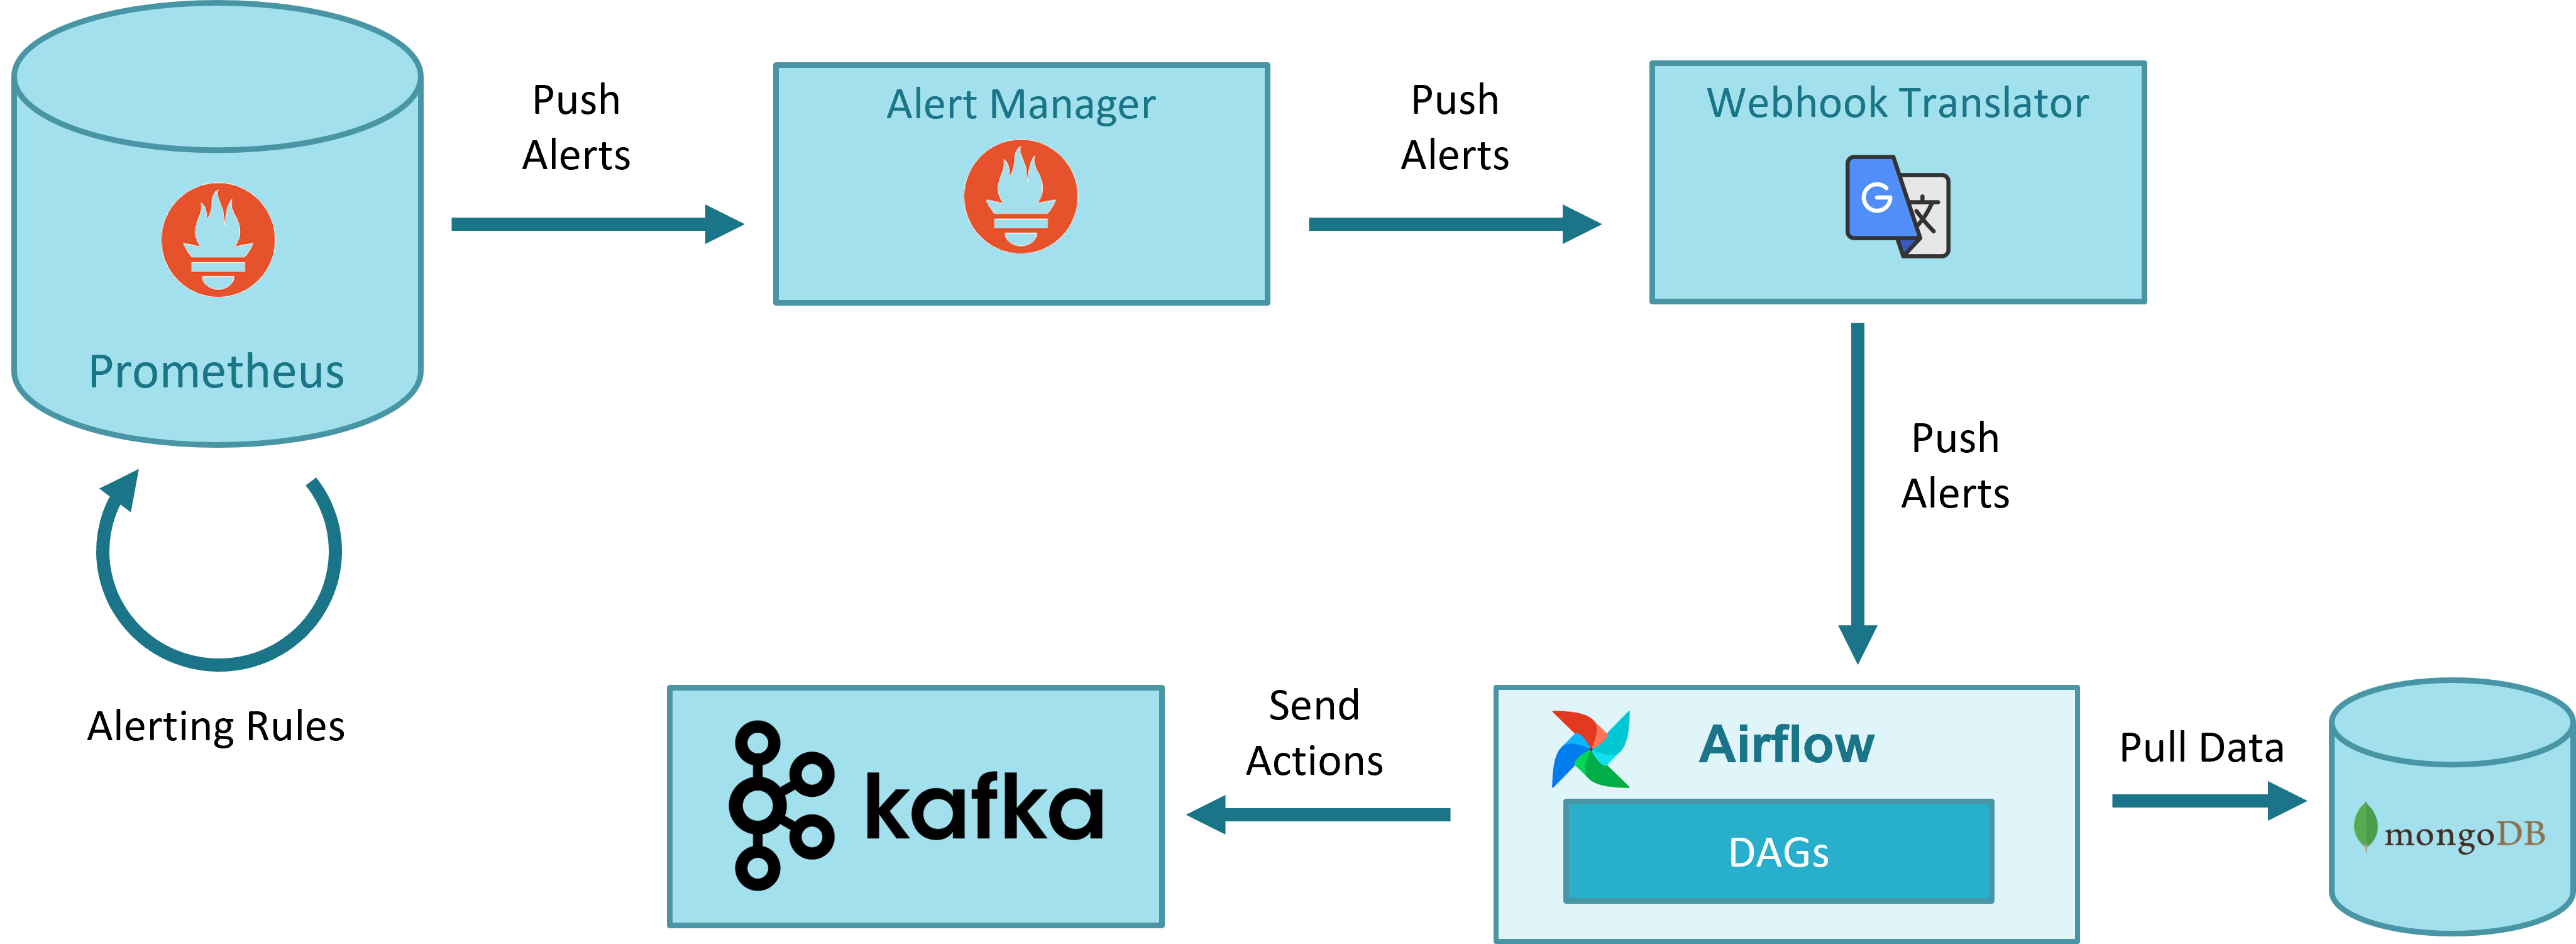
Prometheus alerts. All monitoring information (status of VIMs and VNFs managed by OSM) is stored in Prometheus. Prometheus has a simple alert generation mechanism based on alerting rules that are configured in a similar way as the recording rules. The alerts are automatically triggered and stopped depending on their defining rule.
For the case of auto-healing operation, a static rule is pre-defined, which generates an alert when the status of a VM is down for more than a given period.
For the case of auto-scaling operations, a sidecar container deployed with Prometheus dynamicaly updates the Prometheus alert rules as they are created/deleted by OSM in MongoDB at instantiation/termination time.
AlertManager. AlertManager allows managing alerts, including silencing, inhibition, aggregation and sending out notifications. The alerts generated by Prometheus are sent to AlertManager, which forwards them to a webhook. The use of AlertManager is necessary as an intermediate step because Prometheus cannot send alerts directly to a webhook. In addition, AlertManager includes mechanisms for silencing, inhibition, aggregation, etc., which could be leveraged by OSM in the future.
Webhook Translator. AlertManager can send alerts to multiple external systems via, for example, HTTP, but does not integrate directly with Airflow, which is the system that will run the worflows or DAGs for healing and scaling. Airflow has its own format for webhooks. The Webhook Translator is added to translate HTTP requests: it receives an HTTP request from AlertManager and forwards it to a supported Airflow webhook in the format expected by Airflow.
Airflow DAG driven by webhook. The last step in the pipeline is running the DAG which will process the alert and execute the necessary actions to carry out the closed-loop operation. In the case of auto-healing, when the firing alert about a VM arrives, the DAG will check if there is an auto-healing rule stored in MongoDB regarding to this VM/VDU. In that case, the DAG updates alert status in MongoDB and sends to Kafka a heal message that will be consumed by LCM, which finally performs the healing operation.
MongoDB. The information (auto-healing and auto-scaling rules) used for closed-loop operations is stored in MongoDB in the collection
alerts. LCM is responsible of inserting and deleting the alarm-related objects when an NS is instantiated or terminated.
19.2. EPA Parameters
19.2.1. Virtual CPU
Pinning Policy
Instance vCPU processes are not assigned to any particular host CPU by default, instead, they float across host CPUs like any other process. This allows for features like over committing of CPUs. In heavily contended systems, this provides optimal system performance at the expense of performance and latency for individual instances. Some workloads require real-time or near real-time behavior, which is not possible with the latency introduced by the default CPU policy. For such workloads, it is beneficial to control which host CPUs are bound to an instance’s vCPUs. This process is known as pinning. No instance with pinned CPUs can use the CPUs of another pinned instance, thus preventing resource contention between instances. To configure a flavor to use pinned vCPUs, the CPU policy is set to dedicated.
Supported CPU pinning policies are as follows:
shared: (default) The guest vCPUs will be allowed to freely float across host pCPUs, although they are potentially constrained by NUMA policy.
dedicated: The guest vCPUs will be strictly pinned to a set of host pCPUs. In the absence of an explicit vCPU topology request, the drivers typically expose all vCPUs as sockets with one core and one thread. When strict CPU pinning is in effect, the guest CPU topology is set up to match the topology of the CPUs to which it is pinned.
Thread Policy
CPU thread pinning policy describes how to place the guest CPUs when the host supports hyper threads. Supported CPU thread policies are:
prefer: (default) Attempts to place vCPUs on threads of the same core. The host may or may not have an SMT architecture. Where an SMT architecture is present, thread siblings are preferred.
isolate: Places each vCPU on a different core, and places no vCPUs from a different guest on the same core. The host must not have an SMT architecture or must emulate a non-SMT architecture. If the host does not have an SMT architecture, each vCPU is placed on a different core as expected. If the host does have an SMT architecture - that is, one or more cores have thread siblings - then each vCPU is placed on a different physical core. No vCPUs from other guests are placed on the same core. All but one thread sibling on each utilized core is therefore guaranteed to be unusable.
require: Each vCPU is allocated on thread siblings of the same core. The host must have an SMT architecture. Each vCPU is allocated on thread siblings. If the host does not have an SMT architecture, then it is not used. If the host has an SMT architecture, but not enough cores with free thread siblings are available, then scheduling fails.
EPA CPU Quota
CPU quota describes the CPU resource allocation policy. Limit and Reserve values are defined in MHz. Please see the Quota Parameters section for quota details.
19.2.2. Virtual Interface
EPA VIF Quota
Virtual interfaces quota describes the virtual interface bandwidth resource allocation policy. Limit and Reserve values are defined in Mbps. Please see the Quota Parameters section for quota details.
19.2.3. Virtual Memory
NUMA Enabled
Non-Uniform Memory Access or Non-Uniform Memory Architecture (NUMA) is a physical memory design used in SMP (multiprocessors) architecture. Under NUMA, a processor can access its own local memory faster than non-local memory, that is, memory local to another processor or memory shared between processors. NUMA enabled parameter specifies the memory allocation to be cognisant of the relevant process/core allocation. The cardinality can be 0 during the allocation request, if no particular value is requested. OSM supports NUMA usage by setting numa-enabled parameter to True.
NUMA Node Policy
The policy defines NUMA topology of the guest. Specifically identifies if the guest should be run on a host with one NUMA node or multiple NUMA nodes. The details of numa node policy parameters is given as below:
numa-node-policy:
  - numa-cnt: The number of NUMA nodes to expose to the VM.
  - mem-policy: This policy specifies how the memory should be allocated in a multi-node scenario.
  - node (NUMA node identification):
      - node-id: Id of node. Typically, it's an integer such as 0 or 1 which identifies the nodes.
      - vcpu-id: List of VCPUs to allocate on this NUMA node.
      - memory-mb: Memory size expressed in MB for this NUMA node.
      - om-numa-type: OpenMANO Numa type selection.
          - cores:
            - num-cores: number of cores
          - paired-threads:
            - paired-thread-ids (List of thread pairs to use in case of paired-thread NUMA):
              - thread-a
              - thread-b
          - threads:
            - num-threads: Number of threads
Mem-Policy
Memory policy give the information to the kernel in order to allocate the memory from the specified/unspecified nodes in a NUMA system.
STRICT: The memory must be allocated strictly from the memory attached to the NUMA node.
PREFERRED: The memory should be allocated preferentially from the memory attached to the NUMA node.
EPA Mem-page Size
Memory page allocation size. If a VM requires hugepages, it should choose LARGE or SIZE_2MB or SIZE_1GB. If the VM prefers hugepages, it should choose PREFER_LARGE.
LARGE: Require hugepages (either 2MB or 1GB)
SMALL: Doesn’t require hugepages
SIZE_2MB: Requires 2MB hugepages
SIZE_1GB: Requires 1GB hugepages
PREFER_LARGE: Application prefers hugepages
Memory Quota
Memory quota describes the memory resource allocation policy. Limit and Reserve values are defined in MB. Please see the Quota Parameters for quota details.
19.2.4. Virtual Storage
Disk IO Quota
Disk IO quota describes the disk IO operations resource allocation policy. Limit and Reserve values are defined in IOPS. Please see the Quota Parameters section for quota details.
19.2.5. Quota Parameters
limit: Defines the maximum allocation. The value 0 indicates that usage is not limited. This parameter ensures that the instance never uses more than the defined amount of resource.
reserve: Defines the guaranteed minimum reservation. If needed, the machine will definitely get allocated the reserved amount of resources.
shares: Number of shares allocated. Specifies the proportional weighted share for the domain. If this element is omitted, the service defaults to the OS provided defaults.
19.3. Updating Status of Created Items Periodically in RO Module
RO module configuration file includes the following settings to perform periodic status updates of created items:
refresh_active: The period to poll the active VM status
refresh_build: The period to poll the VM status which is still building
refresh_image: The period to check the status of a created image, flavor item
refresh_error: The period to check the status of a failed item
queue_size: RO task queue size
RO module configuration file includes the default values of refresh periods in seconds as follows:
[period]
refresh_active: 60
refresh_build: 15
refresh_image: 3600 * 10
refresh_error: 600
queue_size: 100
refresh_active parameter is used to update the VM status from VIM for every given period of time seconds. This parameter is allowed to take the values which are equal/greater than 60 or -1. Setting refresh_active to -1 disables the periodic VM updates from VIM. There aren’t defined configuration constraints for the other parameters.
19.3.1. Polling VM status
RO module updates the VDU details in VNF records periodically unless disabled. For VIM types other than Openstack, RO updates the VM status based on vm_id which is kept in the completed ro_tasks collection in the MongoDB. For each virtual machine, it sends several requests to the Cloud APIs to get VM details, networks and ports details. For Openstack VIM type, RO executes a monitoring job which is executed periodically according to refresh_active period. This job collects all the VM details and port details belongs to a VIM account by sending only two requests to Openstack cloud APIs. Then, collected bulk data is parsed and all the active VM status are updated. This improvement in VM polling mechanism for Openstack, prevents hammering Cloud APIs if there are numerous VMs need to be monitored.
19.3.2. Configuring VM status Updates
19.3.2.1. Configuring Refresh Periods in OSM
Kubernetes Deployment of RO Module is updated to add the environment variables with custom values.
image: opensourcemano/ro:testing-daily
env:
- name:  OSMRO_PERIOD_REFRESH_ACTIVE
  value: 120
- name:  OSMRO_PERIOD_REFRESH_BUILD
  value: 30
- name:  OSMRO_PERIOD_REFRESH_IMAGE
  value: 3600
- name:  OSMRO_PERIOD_REFRESH_ERROR
  value: 600
- name:  OSMRO_PERIOD_QUEUE_SIZE
  value: 100
imagePullPolicy: IfNotPresent
name: ro
19.3.2.2. Configuring Refresh Periods in Charmed-OSM
RO charm could be configured to change the refresh periods with the following configuration parameters:
period_refresh_active
period_refresh_build
period_refresh_image
period_refresh_error
period_refresh_queue_size
Sample command to get the VM status updates for each 100 seconds:
juju config ro period_refresh_active=100