OSM Performance Management: Difference between revisions
mNo edit summary |
mNo edit summary |
||
| Line 1: | Line 1: | ||
This is new feature available since the Release FOUR Lightweight build, which allows to continuously monitor VNF metrics and visualize them. | This is new feature available since the Release FOUR Lightweight build, which allows to continuously monitor VNF metrics and visualize them. | ||
As of Release 4.0.0, it is available for OpenStack VIM metrics only. VNF metrics and other VIM types will soon be added during the Release Four cycle. | As of Release 4.0.0, it is available for OpenStack VIM (with Telemetry services) metrics only . VNF metrics and other VIM types will soon be added during the Release Four cycle. | ||
==Basic functionality== | ==Basic functionality== | ||
| Line 10: | Line 10: | ||
osm ns-metric-export --ns vnf01 --vnf 1 --vdu ubuntuvnf_vnfd-VM --metric cpu_utilization | osm ns-metric-export --ns vnf01 --vnf 1 --vdu ubuntuvnf_vnfd-VM --metric cpu_utilization | ||
Possible metric names are: cpu_utilization, average_memory_utilization, | Possible metric names are: cpu_utilization, average_memory_utilization, read_latency_<disk number>, write_latency_<disk number>,disk_read_ops,disk_write_ops,disk_read_bytes,disk_write_bytes,packets_dropped_<nic number>,packets_received, packets_sent | ||
The specific result can be read directly from the Kafka bus topic using a external tool, or can be seen in the MON logs by running a docker logs <MON Container ID> | The specific result can be read directly from the Kafka bus topic using a external tool, or can be seen in the MON logs by running a docker logs <MON Container ID> | ||
Revision as of 14:57, 17 May 2018
This is new feature available since the Release FOUR Lightweight build, which allows to continuously monitor VNF metrics and visualize them.
As of Release 4.0.0, it is available for OpenStack VIM (with Telemetry services) metrics only . VNF metrics and other VIM types will soon be added during the Release Four cycle.
Basic functionality
By default, OSM MON allows to grab any metric, from any VDU and put it on the Kafka Bus, specifically in the 'metrics_response' topic.
Starting with OSM R4, an OSM CLI command is available to export a metric to from the VIM to the bus (in the example: NS name: "vnf01", VNF index: 1, VDU name: "ubuntuvnf_vnfd-VM", metric type: "cpu_utilization")
osm ns-metric-export --ns vnf01 --vnf 1 --vdu ubuntuvnf_vnfd-VM --metric cpu_utilization
Possible metric names are: cpu_utilization, average_memory_utilization, read_latency_<disk number>, write_latency_<disk number>,disk_read_ops,disk_write_ops,disk_read_bytes,disk_write_bytes,packets_dropped_<nic number>,packets_received, packets_sent
The specific result can be read directly from the Kafka bus topic using a external tool, or can be seen in the MON logs by running a docker logs <MON Container ID>
You can also add the '--interval' option to leave it running continuously, for example, every 10 seconds:
osm ns-metric-export --ns vnf01 --vnf 1 --vdu ubuntuvnf_vnfd-VM --metric cpu_utilization --interval 10
Finally, you can leave it running in the background using Linux default tools:
osm ns-metric-export --ns vnf01 --vnf 1 --vdu ubuntuvnf_vnfd-VM --metric cpu_utilization --interval 10 > /dev/null 2>&1 &
Experimental functionality
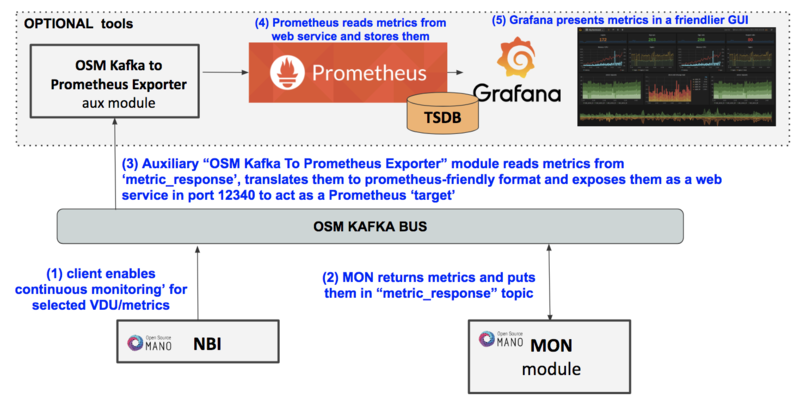
Some extensions have been added to the OSM installer to include an optional 'OSM Performance Management' stack, consisting of a 'Kafka Exporter' component that reads the metrics from the bus, exposes them in Prometheus so it can store them in its TSDB, and presents them in Grafana.
Basic architecture is as follows:
Enabling the OSM Performance Management Stack
If you want to install OSM along with the PM stack, run the installer as follows:
./install_osm_release.sh --pm_stack
If you just want to add the PM stack to an existing OSM R4 Lightweight build, run the installer as follows:
./install_osm_release.sh -o pm_stack
If you need to remove it at some point in time, just run the following command:
docker stack rm osm_metrics
Testing the OSM PM Stack
1. Create a continuous metric, that runs in the background as indicated in the first section.
2. Check if the Kafka Exporter is serving the metric to Prometheus, by visiting http://1.2.3.4:12340/metrics, replacing 1.2.3.4 with the IP address of your host. Metrics should appear in the following text format:
# HELP kafka_exporter_topic_average_memory_utilization
# TYPE kafka_exporter_topic_average_memory_utilization gauge
kafka_exporter_topic_average_memory_utilization{resource_uuid="5599ce48-a830-4c51-995e-a663e590952f",} 200.0
# HELP kafka_exporter_topic_cpu_utilization
# TYPE kafka_exporter_topic_cpu_utilization gauge
kafka_exporter_topic_cpu_utilization{resource_uuid="5599ce48-a830-4c51-995e-a663e590952f",} 0.7950777152296741
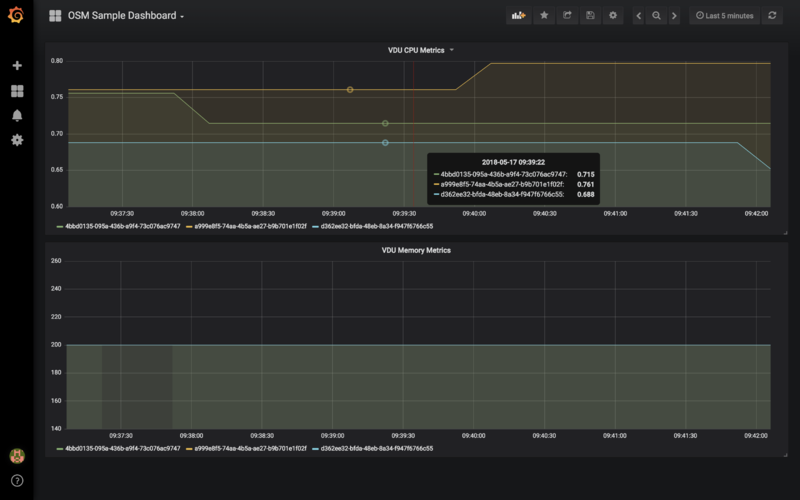
3. Visit Grafana at http://1.2.3.4:3000, replacing 1.2.3.4 with the IP address of your host. Login with admin/admin credentials and visit the OSM Sample Dashboard. It should already show graphs for CPU and Memory. You can clone them and customize as desired.
Please send your feedback and suggestions to OSM_TECH@list.etsi.org

