OSM Fault Management
This documentation corresponds now to Release FIVE, previous documentation related to Fault Management has been deprecated
Basic functionality
Logs & Events
As of Release 5.0.0, logs can be monitored on a per-container basis via command line, like this:
docker logs <container id or name>
For example:
docker logs osm_lcm.1.tkb8yr6v762d28ird0edkunlv
Logs can also be found in the corresponding volume of the host filesystem: /var/lib/containers/[container-id]/[container-id].json.log
Furthermore, there are some important events flowing between components through the Kafka bus, which can be monitored on a per-topic basis by external tools.
Alarm Manager for Metrics
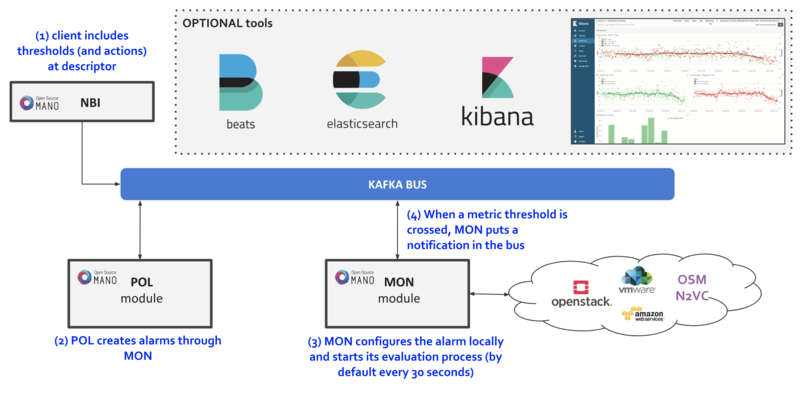
As of Release FIVE, MON includes a new module called 'mon-evaluator'. The only use case supported today by this module is the configuration of alarms and evaluation of thresholds related to metrics, for the Policy Manager module (POL) to take actions such as auto-scaling.
Whenever a threshold is crossed and an alarm is triggered, the notification is generated by MON and put in the Kafka bus so other components can consume them. This event is today logged by both MON (generates notification) and POL (consumes notification, for its auto-scaling action)
By default, threshold evaluation occurs every 30 seconds. This value can be changed by setting an environment variable, for example:
docker service update --env-add OSMMON_EVALUATOR_INTERVAL=15 osm_mon
Further information regarding how to configure alarms through VNFDs for the supported use case can be found at the auto-scaling documentation
Reference diagram:
Experimental functionality
As in the previous release, an optional 'OSM ELK' stack is available to allow for events visualization, consisting of the following tools:
- Elastisearch - scalable search engine and event database.
- Filebeat & Metricbeat - part of Elastic 'beats', which evolve the former Logstash component to provide generic logs and metrics collection, respectively.
- Kibana - Graphical tool for exploring all the collected events and generating customized views and dashboards.
Enabling the OSM ELK Stack
If you want to install OSM along with the ELK stack, run the installer as follows:
./install_osm.sh --elk_stack
If you just want to add the ELK stack to an existing OSM installation, run the installer as follows:
./install_osm.sh -o elk_stack
This will install four additional docker containers (Elasticsearch, Filebeat, Metricbeat and Kibana), as well as download a Docker image for an auxiliary tool named Curator (bobrik/curator)
If you need to remove it at some point in time, just run the following command:
docker stack rm osm_elk
If you need to deploy the stack again after being removed:
docker stack deploy -c /etc/osm/docker/osm_elk/docker-compose.yml osm_elk
IMPORTANT: As time passes and more events are generated in your system, and depending on your configured searches, views and dashboards, Elasticsearch database which become very big, which may not be desirable in testing environments. In order to delete your data periodically, you can launch a Curator container that will delete the saved indexes, freeing the associated disk space.
For example, to delete all the data older than the last day:
docker run --rm --name curator --net host --entrypoint curator_cli bobrik/curator:5.5.4 --host localhost delete_indices --filter_list '[{"filtertype":"age","source":"creation_date","direction":"older","unit":"days","unit_count":1}]'
Or to delete the data older than 2 hours:
docker run --rm --name curator --net host --entrypoint curator_cli bobrik/curator:5.5.4 --host localhost delete_indices --filter_list '[{"filtertype":"age","source":"creation_date","direction":"older","unit":"hours","unit_count":2}]'
Testing the OSM ELK Stack
1. Download the sample dashboards to your desktop from this link (right click, save link as): https://osm-download.etsi.org/ftp/osm-4.0-four/4th-hackfest/other/osm_kibana_dashboards.json 2. Visit Kibana at http://[OSM_IP]:5601 and:
- Go to "Management" --> Saved Objects --> Import (select the downloaded file)
- Go to "Dashboard" and select the "OSM System Dashboard", which connects to other three sub-dashboards (You may need to redefine "filebeat-*" as the default 'index-pattern' by selecting it, marking the star and revisiting the Dashboards)
- Metrics (from Metricbeat) and logs (from Filebeat) should appear at the corresponding visualizations.
Your feedback is most welcome!
You can send us your comments and questions to OSM_TECH@list.etsi.org
Or join the OpenSourceMANO Slack Workplace
See hereafter some best practices to report issues on OSM
