OSM Fault Management
This is new set of features are available since the Release FOUR Lightweight build, by gradually adding capabilities on log visibility, events and failures of both the system and network services.
Basic functionality
Logs & Events
As of Release 4.0.0, logs can be monitored on a per-container basis via command line, like this:
docker logs <container id or name>
Furthermore, there are some important events flowing between components through the Kafka bus, which can be monitored on a per-topic basis by external tools.
VDU-level alarms and thresholds
By default, alarms can be configured through the MON component at the VIM level, in order to receive a notification whenever a metric threshold is crossed.
Starting with OSM R4, it is possible to configure an alarm via the OSM CLI, by running the following command (in the example: NS name: "vnf01", VNF index: 1, VDU name: "ubuntuvnf_vnfd-VM", metric type: "cpu_utilization", severity: "critical", threshold value: 50, operator: "greater than", statistic measuring type: "average", name: "scale_out_alarm")
osm ns-alarm-create --ns vnf01 --vnf 1 --vdu ubuntuvnf_vnfd-VM --metric cpu_utilization --severity critical --threshold_value 50 --threshold_operator GT --statistic AVERAGE scale_out_alarm
Possible metric names are: cpu_utilization, average_memory_utilization, disk_read_ops,disk_write_ops,disk_read_bytes,disk_write_bytes,packets_dropped_<nic number>,packets_received, packets_sent
Other parameter options can be explored through running "osm ns-alarm-create --help".
Whenever an alarm is triggered, the notification is received by MON and put in the bus so other components can consume them. For example, there is a new Policy Manager component that soon will be able to take actions like further logging or scaling based on this notifications.
Please note that:
- As of Release 4.0.0, alarm creation has been tested with OpenStack VIM with Keystone v3 authentication, Aodh service and legacy or Gnocchi-based telemetry services. VNF-based alarms and other VIM types will soon be added during the Release Four cycle.
- For the alarm to be created, the metric has to exist at the VIM level. If the VDU has just been created, this could take a little while. Please check out the MON logs to confirm its creation (docker logs <MON container id or name>
- For OpenStack, the Gnocchi granularity should match that of the alarm, by default both values are set to 300 seconds. If your VIM has a different granularity, you can update it at MON with an environment variable, for it to create alarms with the new granularity value. For example:
docker service update --env-add OS_DEFAULT_GRANULARITY=60 osm_mon
Experimental functionality
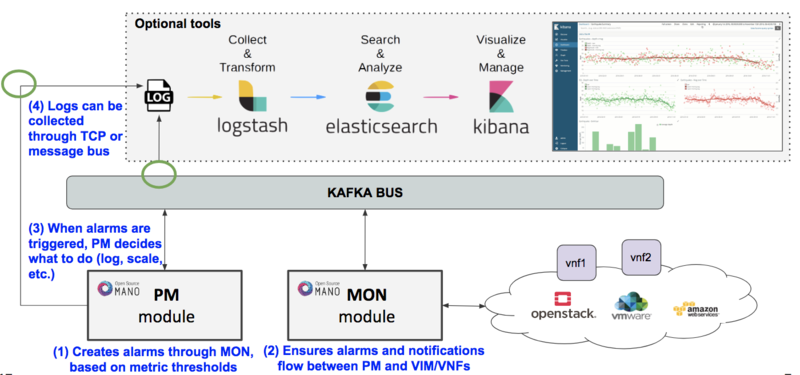
Some extensions have been added to the OSM installer to include an optional 'OSM ELK' stack to allow for events visualization, consisting of an ELK stack, with minor configurations that make it able to monitor some kakfa topics and logs.
Basic architecture is as follows:
Enabling the OSM ELK Stack
If you want to install OSM along with the ELK stack, run the installer as follows:
./install_osm.sh --elk_stack
If you just want to add the ELK stack to an existing OSM R4 Lightweight build, run the installer as follows:
./install_osm.sh -o elk_stack
This will install three additional docker containers (Elasticsearch, Logstash and Kibana)
If you need to remove it at some point in time, just run the following command:
docker stack rm osm_elk
If you need to deploy the stack again after being removed:
docker stack deploy -c /etc/osm/docker/osm_elk/docker-compose.yml osm_elk
Testing the OSM ELK Stack
By default, the available ELK Stack monitors the 'alarm_response' Kafka topic, and any log sent to TCP port 5000.
1. Visit Kibana frontend at http://1.2.3.4:5601, replacing 1.2.3.4 with the IP address of your host.
- Note: during installation, the script tries to add a 'default pattern' which the ELK system needs to match which logs to present from Logstash. If you hit 'Discover' and Kibana still asks you to create a default index pattern, just paste the following script in your OSM host:
curl -f -XPOST -H "Content-Type: application/json" -H "kbn-xsrf: anything" \
         "http://localhost:5601/api/saved_objects/index-pattern/logstash-*" \
         -d"{\"attributes\":{\"title\":\"logstash-*\",\"timeFieldName\":\"@timestamp\"}}"
curl -XPOST -H "Content-Type: application/json" -H "kbn-xsrf: anything" \
         "http://localhost:5601/api/kibana/settings/defaultIndex" \
         -d"{\"value\":\"logstash-*\"}"
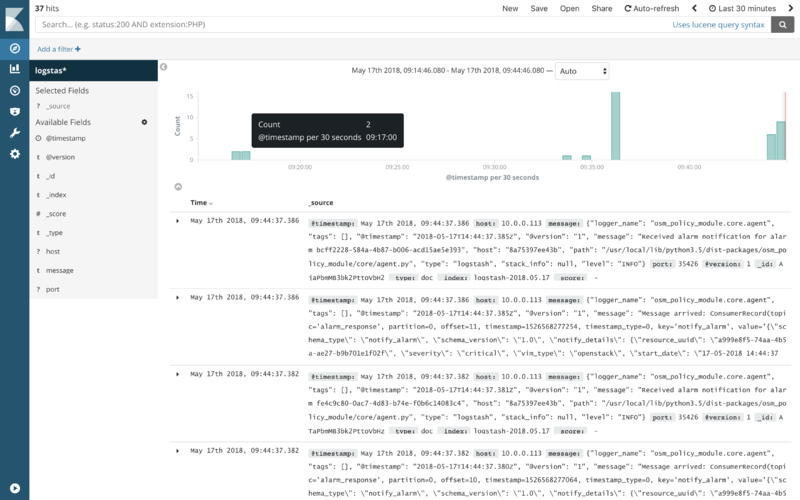
2. Create an alarm following the example above and you will see an event appear at the histogram. This event came from the 'alarm_response' topic.
3. Trigger a VDU alarm (with CPU spikes or any other mechanism), and you will see a notification arrive at Kibana. This event came from the 'alarm_response' topic as well.
4. Configure the Policy Manager component to log events to Logstash through port TCP 5000, and repeat (3), you will see further details whenever an alarm is triggered.
docker service update --env-add LOGSTASH_URI=logstash:5000 osm_pm
In the near future, more components will have visibility through Kibana.
Your feedback is most welcome!
You can send us your comments and questions to OSM_TECH@list.etsi.org
Or join the OpenSourceMANO Slack Workplace
See hereafter some best practices to report issues on OSM

